I am Md Khadem Ali (cited as: Ali, M. K.), an
undergraduate student of B.Sc (Honours) in Geography and
Environment at National University, Bangladesh, actively engaged
in independent undergraduate research. My work focuses on
environmental systems, spatial analysis, and geospatial
modelling, guided by the principle that sincere learning,
careful practice, and ethical application form the basis of
meaningful scholarly contribution.
I was born and raised in Natore (24.41°N, 88.93°E), historically
known as the Land of Queen for its association with Queen Rani
Bhabani (Ardhabangeshwari), one of the most influential
zamindars of Bengal. The region was shaped by the
eighteenth-century Natore Raj established by Raja Ramjivan Roy
in 1706. Known for its agricultural landscapes, wetlands, and
cultural heritage, this environment developed my early curiosity
about natural processes and human environment relationships. My
education began at Garfa Govt. Primary School and continued at
D.K High School. I later pursued higher secondary studies at St.
Joseph's School & College in Natore, where disciplined learning
and academic responsibility became central to my development. I
am currently based in Pabna for my undergraduate studies,
continuing to strengthen my academic and analytical skills.
My academic interests center on Geographic Information Systems
(GIS), Remote Sensing, and geospatial technologies applied to
environmental assessment, sustainable development, spatial
intelligence, and emerging applications in supply chain
logistics optimization and Geo-Digital twins systems. I work
with spatial data analysis, satellite imagery interpretation,
and time-series methods to investigate environmental
variability, seasonal dynamics, and long-term spatial patterns.
I also apply machine learning and geospatial data science
techniques using programming environments such as Python, R, and
MATLAB to analyse complex environmental datasets and develop
predictive insights. Furthermore, I am actively exploring the
integration of geospatial analytics, Geo-Digital twins
frameworks, and spatial modelling into vehicle supply chain and
logistics optimization for intelligent and data-driven decision
support. My workflow frequently involves platforms including
ArcGIS Pro, QGIS, and Google Earth Engine, enabling me to
transform scientific data into practical and evidence-based
outcomes.
Beyond academics, I am fluent in English and Bengali and
consider clear communication essential for effective
collaboration and global academic engagement. I also have
experience in school-level teaching, which strengthened my
mentoring, communication, and academic leadership skills.
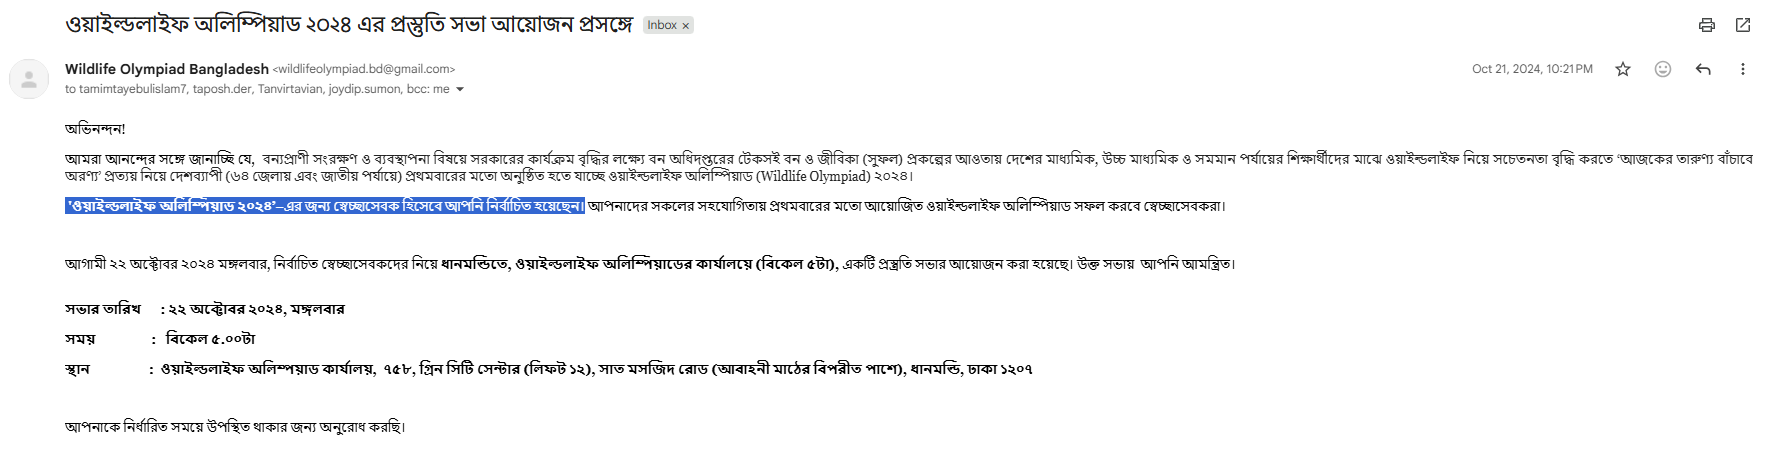
Additionally, I am involved in voluntary initiatives that
reflect my commitment to environmental responsibility and social
contribution. Currently seeking opportunities for research
collaboration in environmental and geospatial studies.
Open to research collaboration and academic discussion
Ali, M. K., Sumi, M. S. A., Islam, M. T., & Ali, O. A.
(2026).
Geospatial Intelligence for Disaster Resilience: A
Narrative Review of Integrated GIS, Remote Sensing, AI,
and Spatial Analytics for Disaster Risk Reduction.
Manuscript submitted to Natural Hazards (Springer). [Under
review]
Q1 • IF 3.7 • CiteScore 7.8 • H-Index: 152
#1
Nur, A. H., Hasan, M. F., Afyare, A., Mohamed, I. A.,
Ali, M. K., & Ali, O. A.
(2026).
Assessing the Drivers of Drought in East Africa and
Identifying Sustainable Mitigation Strategies: A Review.
Manuscript submitted to Frontiers in Environmental Science
(Frontiers). [Under review]
Q1 • IF 3.4 • CiteScore 7.0
Conference Paper
#1
Mahfuj, I. I., Tamim, N. F., Mulla, M. A. R,
Ali, M. K., & Arsalan, M. S.
(2026).
Spatio-Temporal Analysis and Forecasting of Land Cover
and Land Surface Temperature in Ishwardi Upazila,
Bangladesh Using Machine Learning and CA-Markov
Modeling.
Abstract accepted at the International Symposium on Energy
and Environment, 2026.
Preprint
#1
Ali, M. K.
(2026).
Integrating remote sensing and MODIS-based time-series
analysis to quantify seasonal vegetation rhythm
disruptions: A case study.
SSRN.
doi: 10.2139/ssrn.6055754
Research Interests
My research interests and focus include
Geospatial AI (GeoAI) in GIS and Remote Sensing;
Climate Change and Disaster Risk Analytics;
Geospatial Digital Twins and Smart Systems;
Spatial Supply Chain and Logistics Optimization; and
Machine Learning for Earth Observation and Spatial Modeling.
Professional
Climate and Environmental Research Institute (CERI)
Head of Department, Geospatial & Data Analytics Department
16 April 2026 - Present | Somalia
| Remote
Leading research initiatives in geospatial analysis and
data-driven environmental studies.
Managing and guiding projects involving GIS, remote sensing,
and spatial modeling.
Coordinating with interdisciplinary teams to produce impactful
research outputs.
Overseeing data analytics workflows and ensuring quality
research standards.
Learning Point Coaching Center
Geography and Environment Instructor
27 January 2025 - 01 September 2025 |
Pabna | Part-Time
Worked as an Instructor of Geography and Environmental Science
at Learning Point Coaching Center, teaching students of Class
Nine and Ten.
Served as a Graphic Designer for educational content creation,
strengthening creative and technical expertise.
Built professional experience aligned with academic background
and developed strong collaborative relationships with
colleagues.
Polash Cadet School
Assistant Teacher
14 May 2024 - 31 May 2025 | Pabna
| Part-Time
Teaching students of Class Three, Four, and Five, currently
serving as a dedicated Class Five teacher.
Specialize in General Mathematics, General Science, and
Bengali, creating an inclusive and engaging classroom
environment.
Strengthened interpersonal skills and ability to build
meaningful relationships with students and colleagues.
Society Memberships
Esri Young Professionals Network (YPN)
Member
Member Since: May 2026 - Present
Member of Esri’s global professional network for emerging
GIS and geospatial professionals.
Access to GIS career resources, professional networking,
webinars, and geospatial community initiatives.
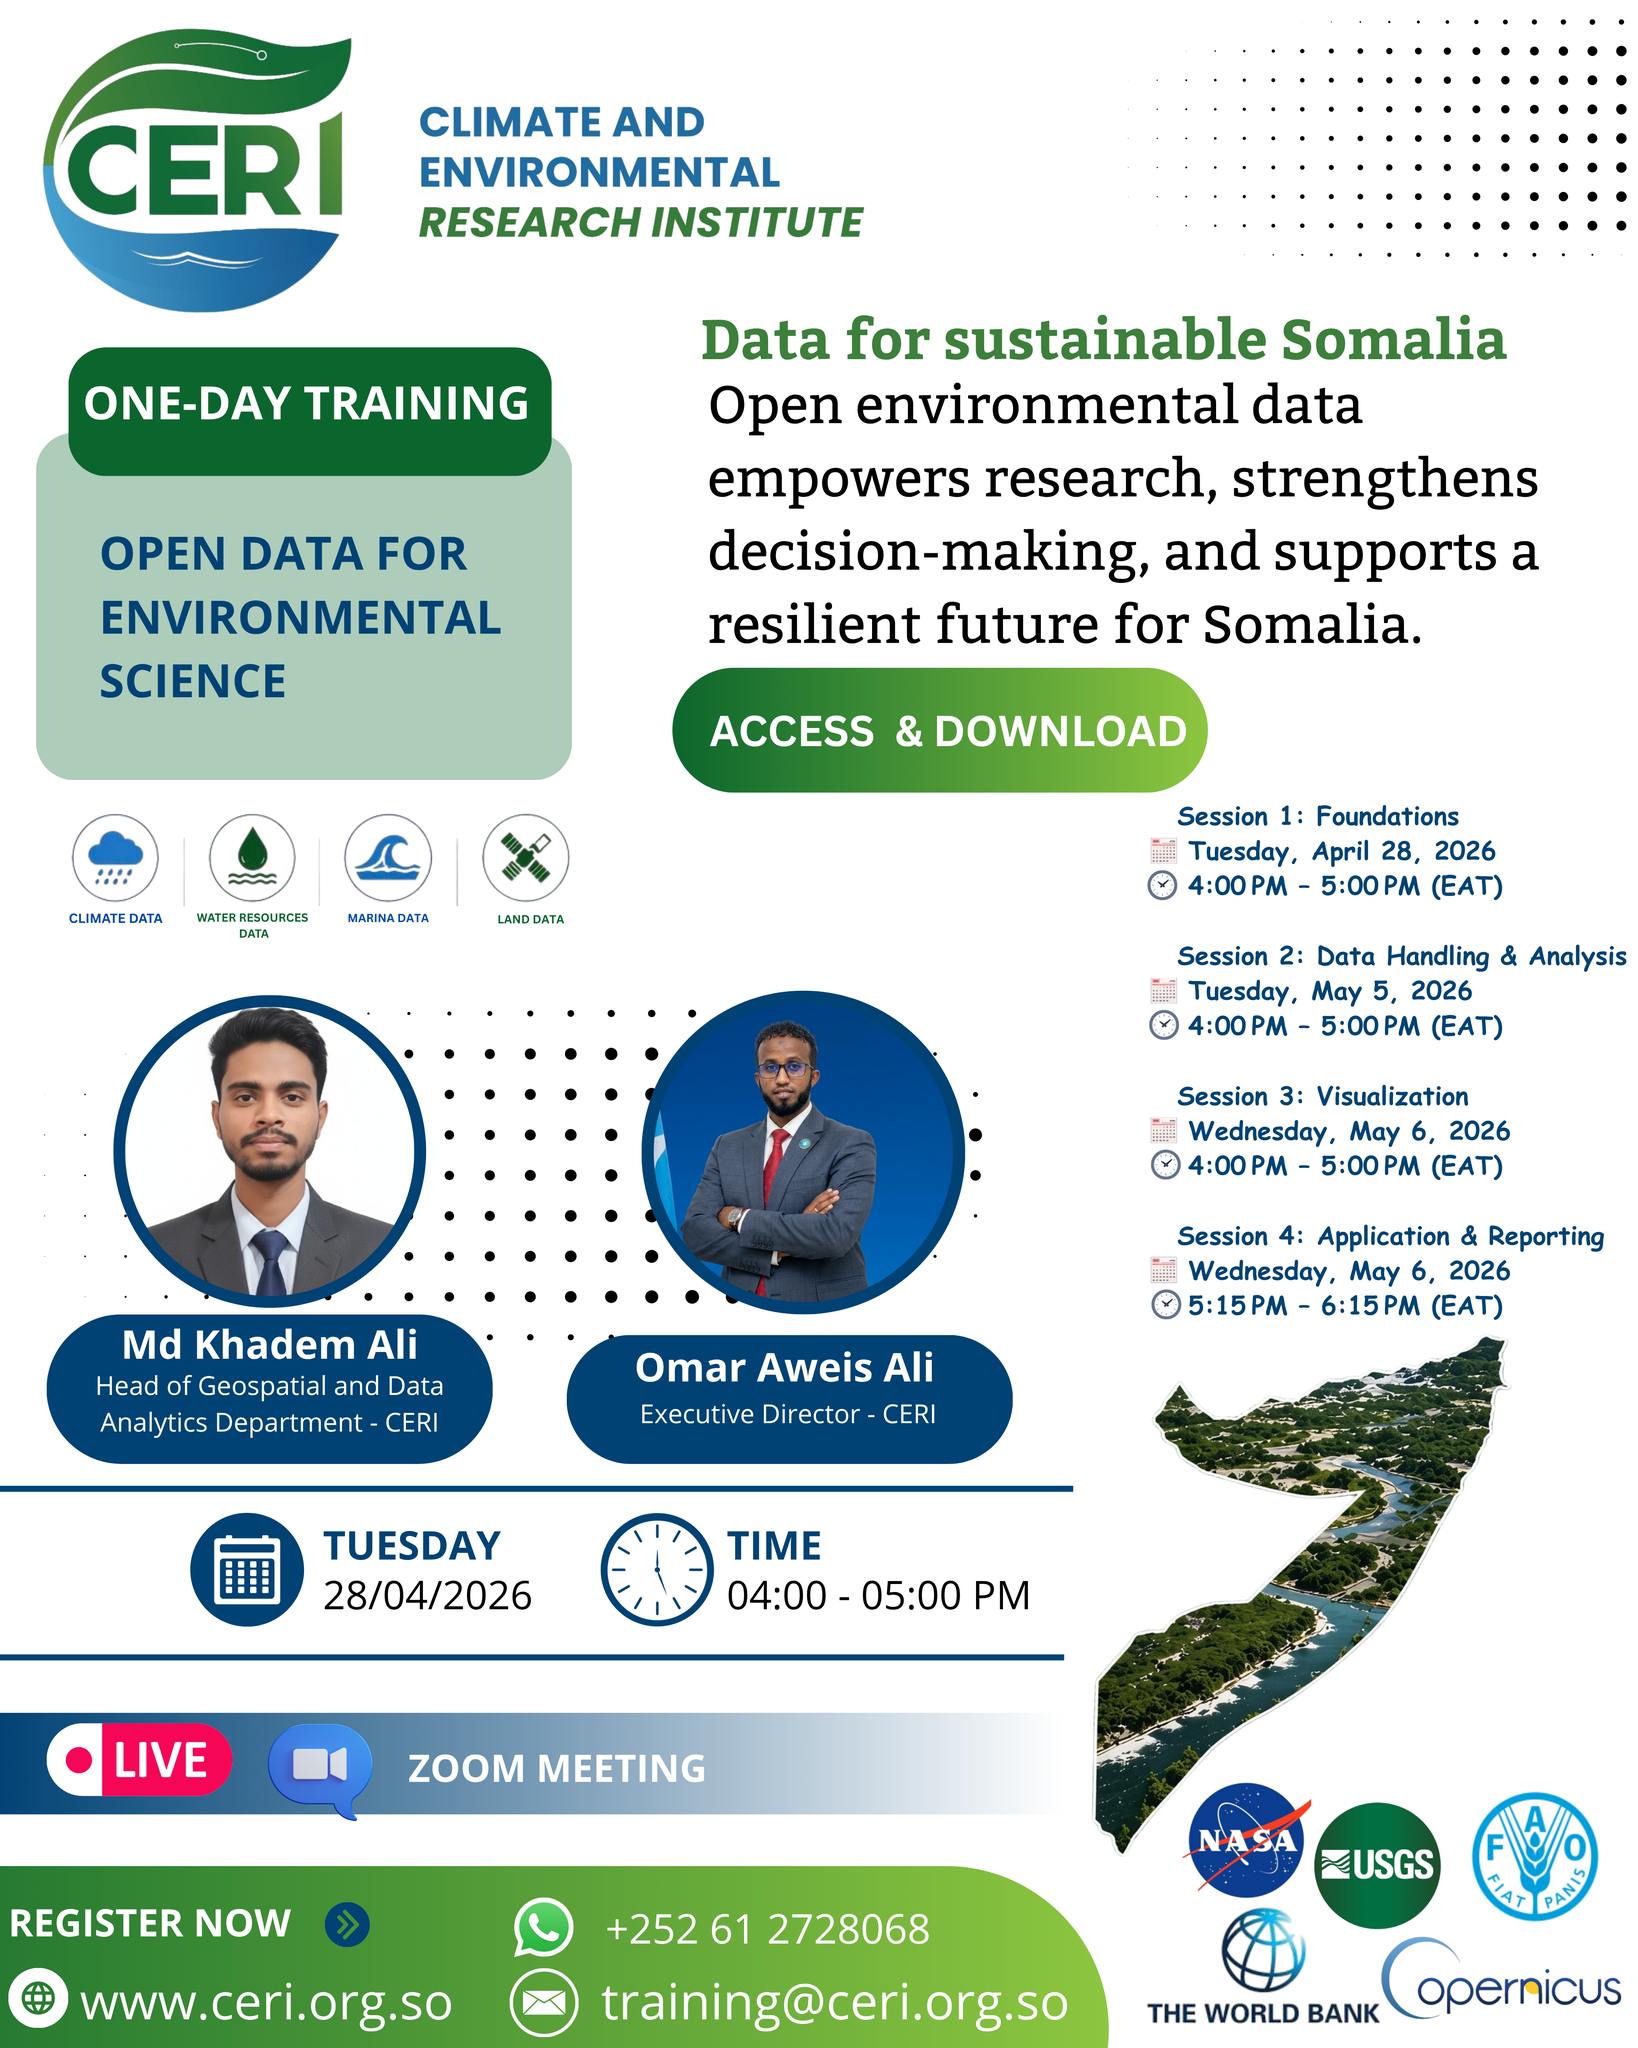
Delivered a hands-on training session on environmental data
access and fundamentals for an international group of
students, demonstrating early engagement in applied
geospatial analysis and effective communication in a diverse
learning environment.
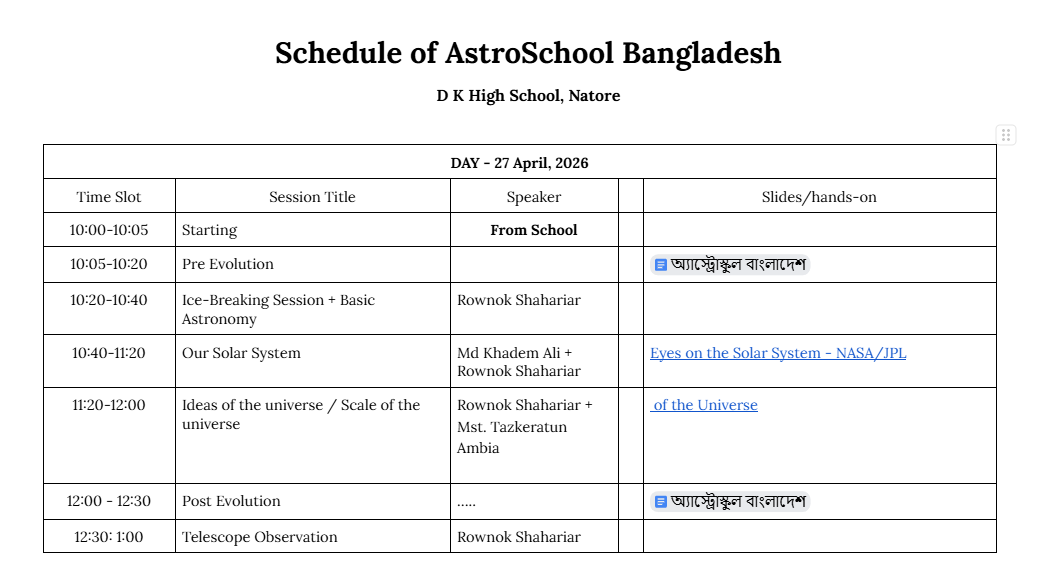
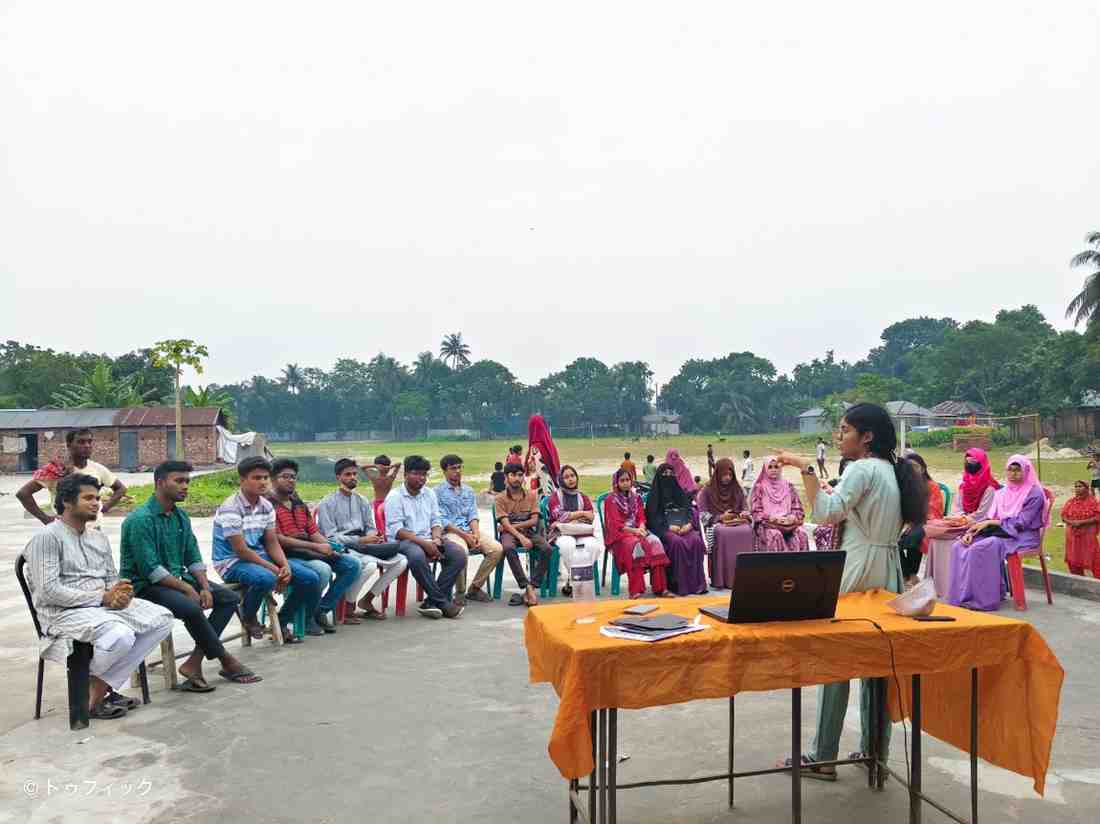
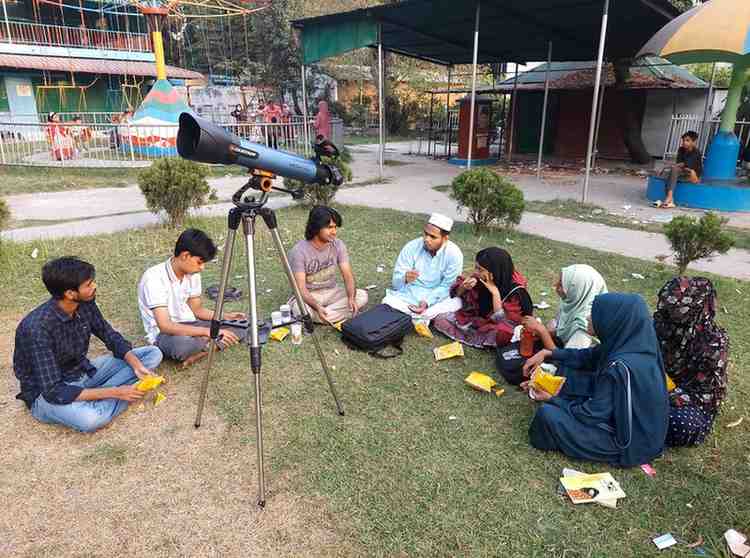
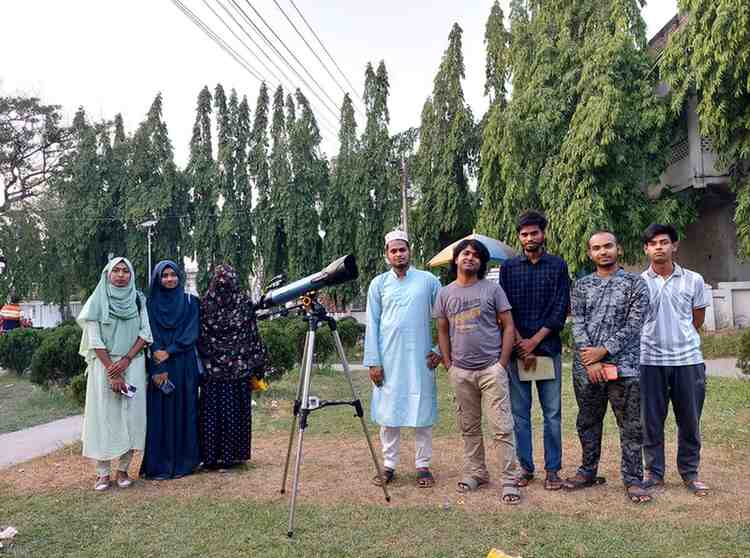
AstroSchool Outreach Program
International Astronomical Union, National Outreach Coordinator
Bangladesh, Taranga
April 27, 2026
D.K High School, Natore
10:00 AM–1:00 PM (BD Time, UTC+6)
Role: Session Contributor & Volunteer
(Delivered session on Our Solar System)
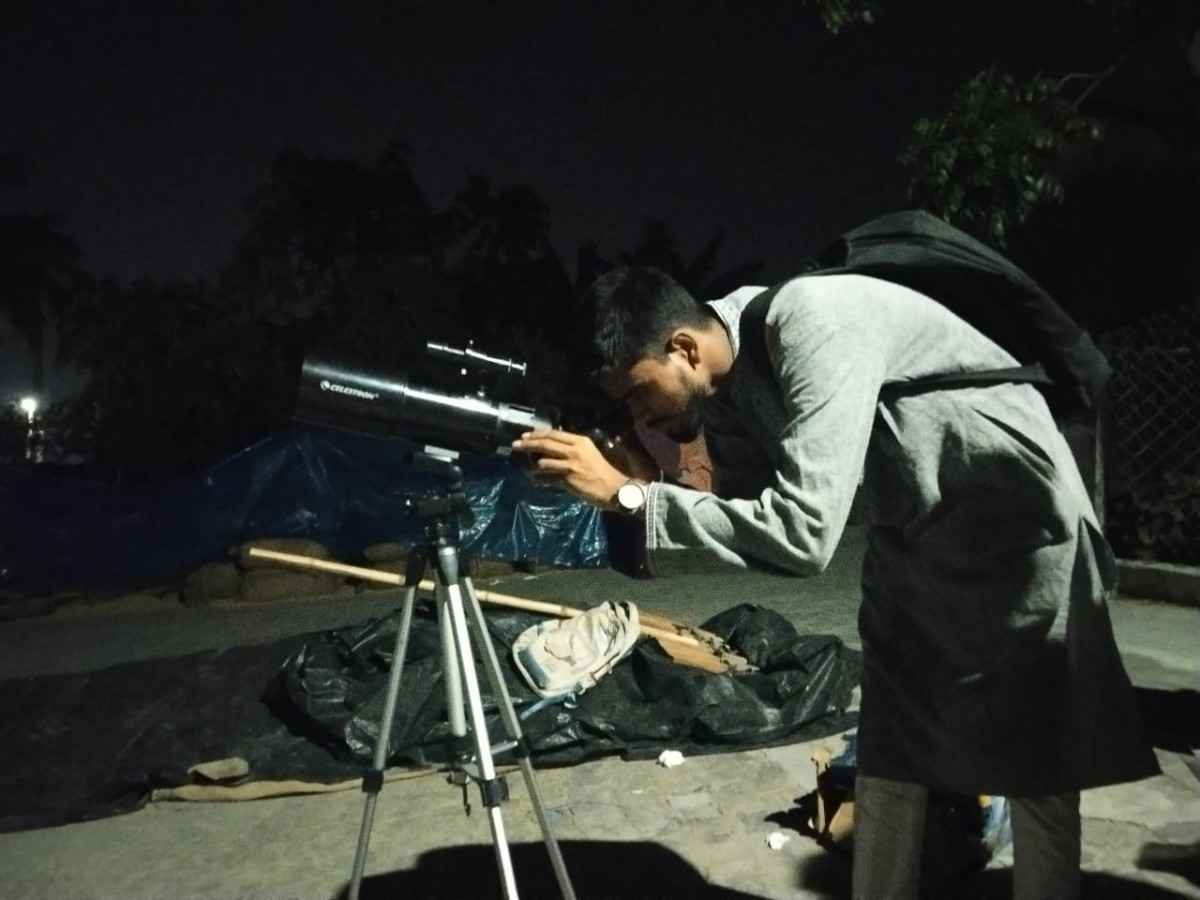
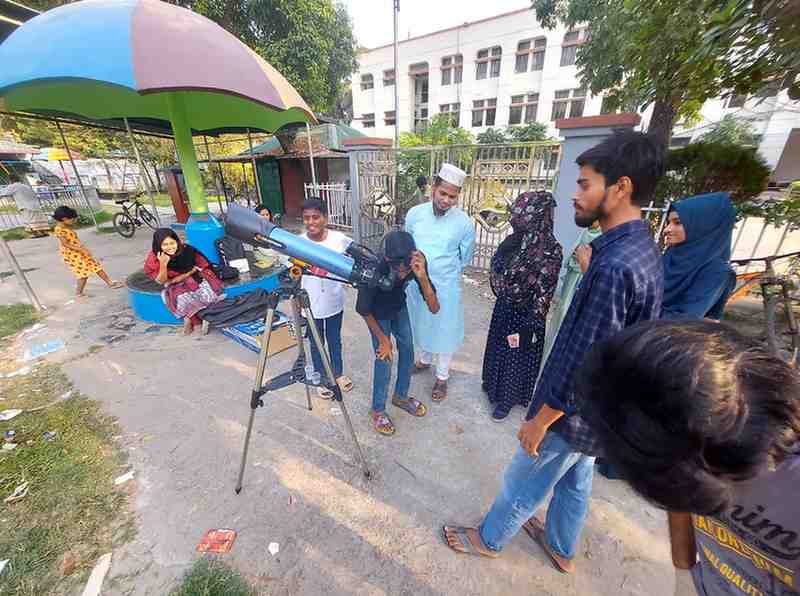
Contributed to an interactive astronomy outreach program
designed to make space science accessible through hands-on
learning, including activity-based sessions and guided
observation.
• Conducted session on Solar System using NASA/JPL resources
Taught Geography and Environment to Class 9-10 students,
maintaining effective communication to ensure lessons were
easy to understand.
Utilized my academic background in the same subjects to
explain topics clearly and help students achieve strong
academic results.
Assistant Teacher
Polash Cadet School
May 14, 2024 – May 31, 2025
Worked closely with students of Class 3, 4 and 5, primarily
responsible for Class 5.
Focused on General Mathematics, General Science, and Bengali,
creating a supportive and engaging learning environment.
Tutor Experience
Private Tutoring (2021 – Present)
Helped over 25+ students increase reading proficiency through
personalized coaching.
Received consistent positive feedback from parents for
significant academic improvements.
Teaching Summary
I have diverse teaching experience across schools, coaching
centers, and private tutoring. I have taught Geography and
Environment to Class 9 and 10 students at
Learning Point Coaching Center, using clear
communication and leveraging my academic background to help
students understand concepts effectively and achieve strong
results. Previously, I worked as an Assistant Teacher at
Polash Cadet School, supporting students from
Classes 3 to 5 in General Mathematics, General Science, and
Bengali while fostering a positive and engaging learning
environment. In addition to institutional teaching, I have been
providing personalized tutoring since 2021, helping over 25+
students improve their reading proficiency and consistently
receiving positive feedback from parents on their academic
progress.
Skills
GIS & Remote Sensing
ArcGIS Pro, QGIS, Google Earth Engine
(Working knowledge of ENVI, ERDAS IMAGINE, SNAP, SAGA GIS;
familiar with GRASS GIS, IDRISI, PCI Geomatica)
I have independently completed
30+
applied projects in Time Series Analysis, Geo-Digital Twins,
Geospatial Analytics, GIS & Remote Sensing, Cartography,
Python-based geospatial libraries, and Chrome Extension development,
focusing on Environmental Monitoring, Earth Observation,
Agriculture, and Urban Analysis, demonstrating strong practical
skills and real-world problem-solving expertise.
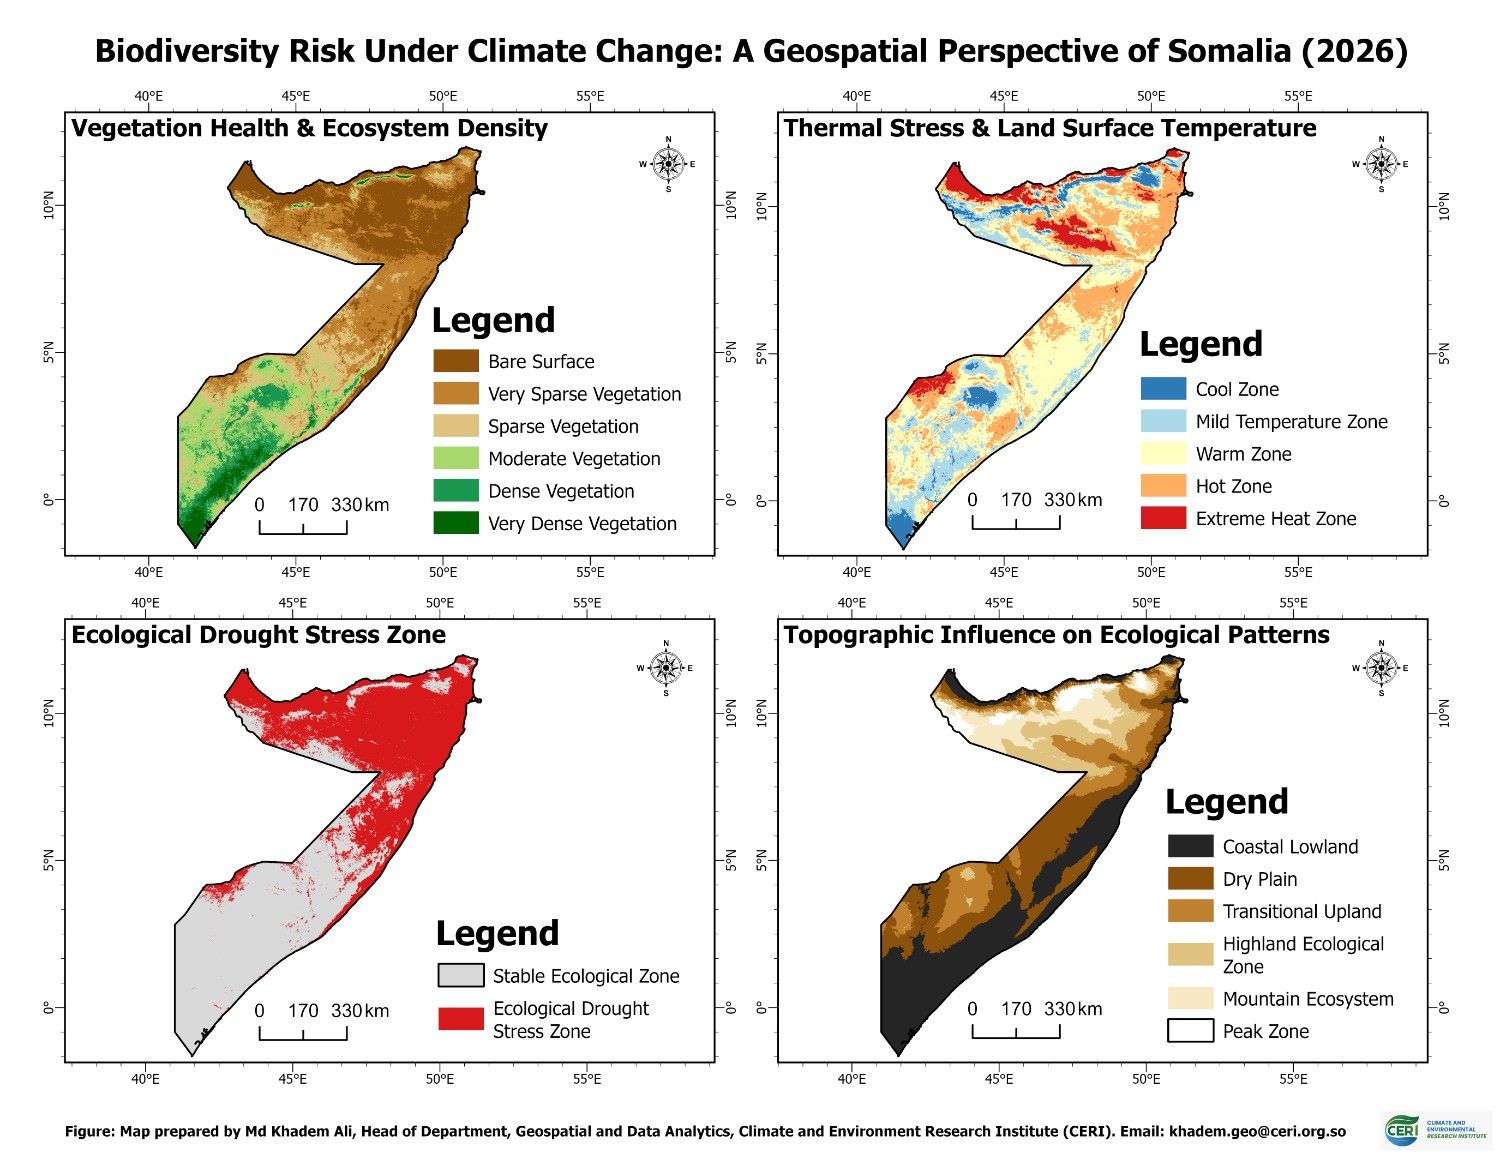
Biodiversity Risk Under Climate Change: A Geospatial Perspective
of Somalia (2026)
This project presents a multi-layer geospatial analysis of
biodiversity risk under climate change in Somalia using
satellite-based remote sensing and GIS techniques. The study
integrates vegetation health (NDVI), land surface temperature
(LST), ecological drought stress, and elevation-based ecological
zoning to assess environmental vulnerability patterns.
Multi-source datasets from MODIS (NDVI and LST) and SRTM Digital
Elevation Model were processed using Google Earth Engine
(JavaScript) and further visualized in ArcGIS Pro for
cartographic enhancement. A baseline NDVI anomaly approach was
applied to identify ecological drought stress zones, while
temperature and vegetation dynamics were analyzed to understand
climate-induced spatial variations. The results reveal strong
spatial disparities in ecological conditions across Somalia,
where low vegetation density and high surface temperature
regions correspond to severe biodiversity stress zones. In
contrast, elevated and less disturbed regions show relatively
stable ecological conditions.
Research Conducted Under: Climate and Environmental Research
Institute - CERI
Research Theme: Climate Change & Biodiversity Assessment
Map Analysis and Cartography by: Md Khadem Ali
Data Sources: MODIS (NDVI, LST), SRTM DEM (NASA Earthdata)
Tools Used: Google Earth Engine (JavaScript), ArcGIS Pro
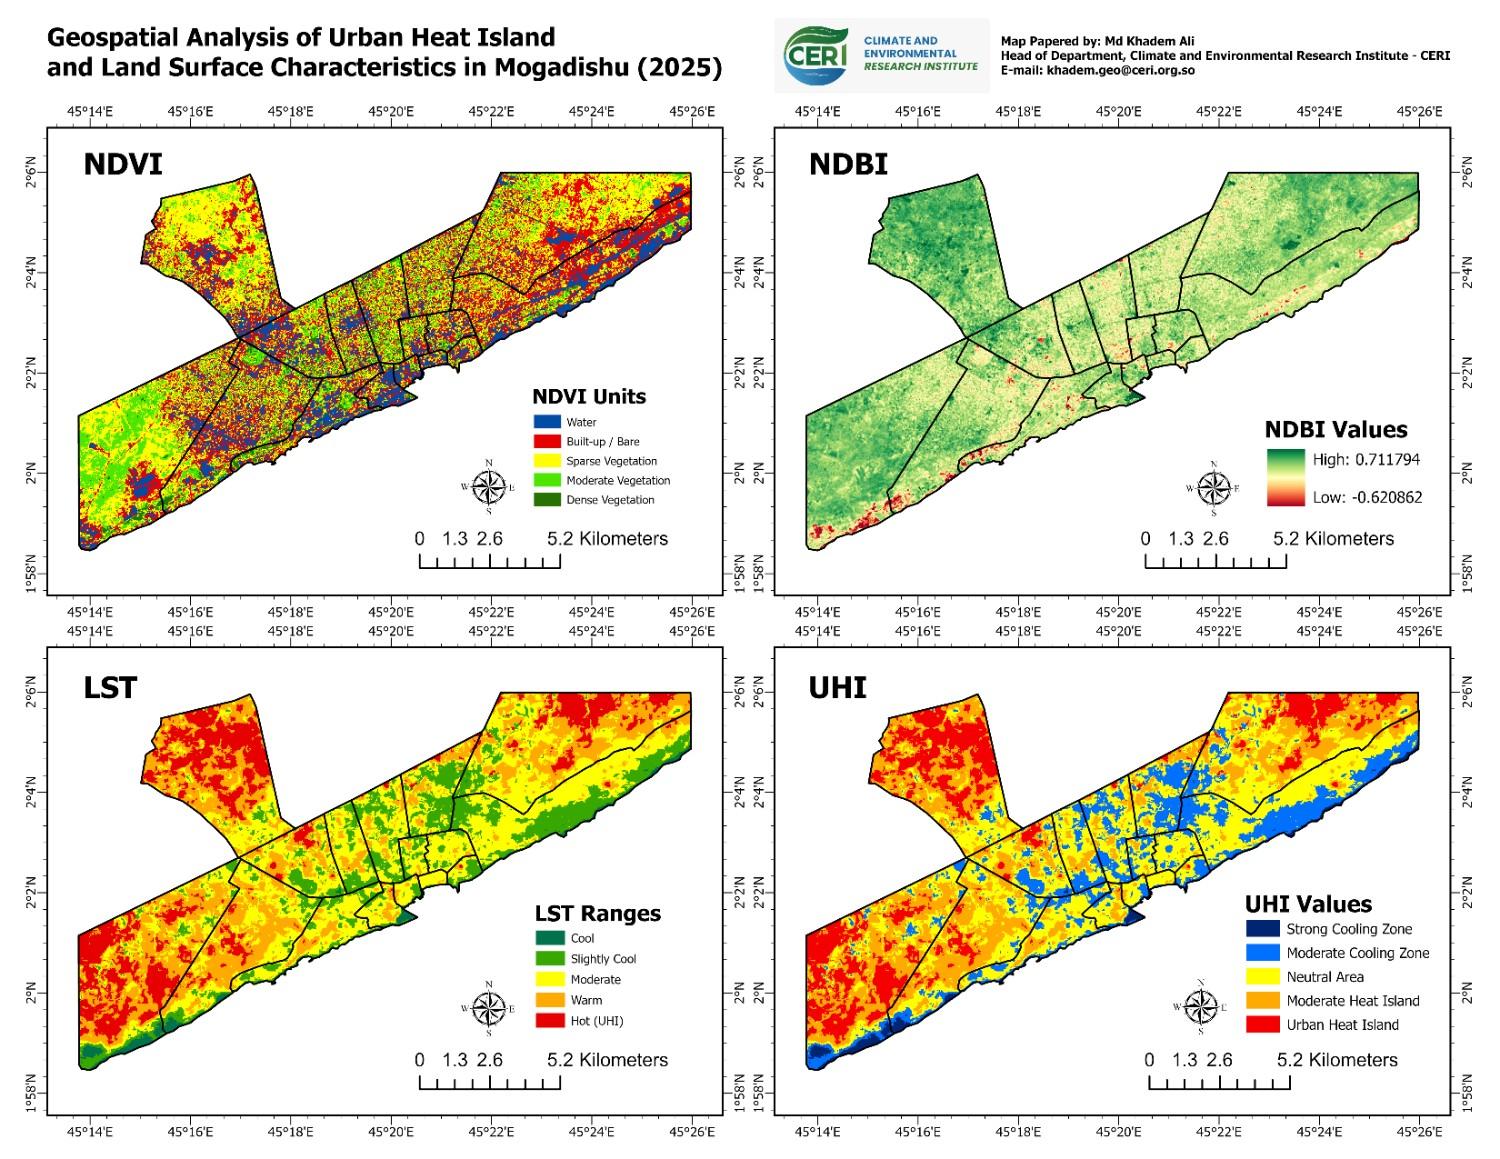
Geospatial Analysis of Urban Heat Island and Land Surface
Characteristics in Mogadishu (2025)
This project presents a comprehensive geospatial analysis of the
Urban Heat Island (UHI) effect in Mogadishu, Somalia, using
satellite-based remote sensing and GIS techniques. Multi-source
data derived from Landsat 8 Collection 2 Level-2 were processed
in Google Earth Engine (JavaScript) to generate key
environmental indicators, including Normalized Difference
Vegetation Index (NDVI), Normalized Difference Built-up Index
(NDBI), Land Surface Temperature (LST), and Urban Heat Island
(UHI) intensity. An unsupervised land use/land cover (LULC)
classification approach was applied using K-means clustering to
identify major land surface types such as vegetation, built-up
areas, bare land, and water bodies. The results reveal a strong
spatial relationship between urban expansion and elevated
surface temperatures, with high UHI intensity observed in
densely built-up regions, while vegetated and water-covered
areas exhibit significant cooling effects.
Research Conducted Under: Climate and Environmental Research
Institute - CERI
Map Analysis and Cartography by: Md Khadem Ali
Data Source: Landsat 8 Surface Reflectance & Thermal
(Collection 2 Level-2)
Tools Used: Google Earth Engine (JavaScript), ArcGIS Pro
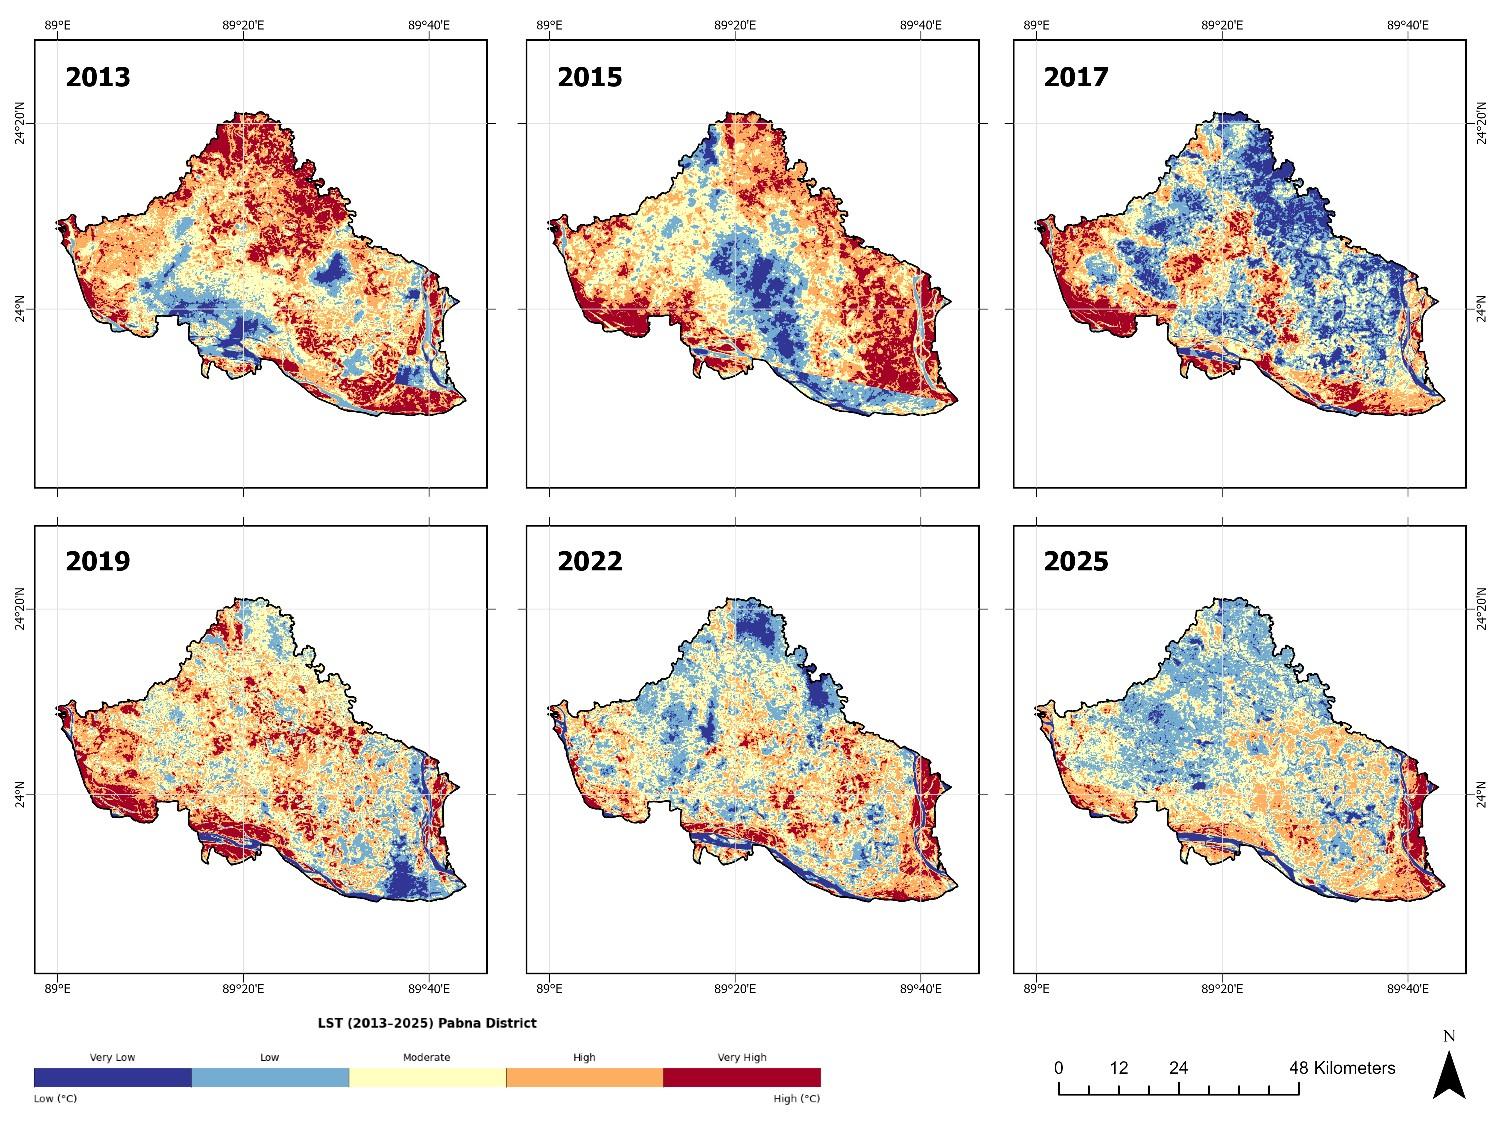
Mapping Surface Thermal Dynamics: A Land Surface Temperature
Study of Pabna District (2013–2025)
This project presents a GIS-based Land Surface Temperature (LST)
analysis of Pabna District, Bangladesh (2013–2025).
Satellite-derived thermal data processed in Google Earth Engine
(JavaScript) were used to generate year-wise LST maps, which
were further analyzed and visualized using Python and ArcGIS
Pro. The temperature values were classified into five
categories: very low (<22°C), low (22–26°C), moderate (26–30°C),
high (30–34°C), and very high (>34°C). The analysis indicates
relatively lower temperatures in 2013 and 2015, while higher
temperature zones became more prominent from 2019 to 2025,
highlighting a temporal shift in surface thermal patterns across
the study area.
Map Analysis and Cartography by: Md Khadem Ali
Data Source: Landsat 8/9 Surface Temperature (Collection 2
Level-2)
Tools Used: Google Earth Engine (JavaScript), Python, ArcGIS
Pro
Coordinate System: WGS 1984 / EPSG:4326
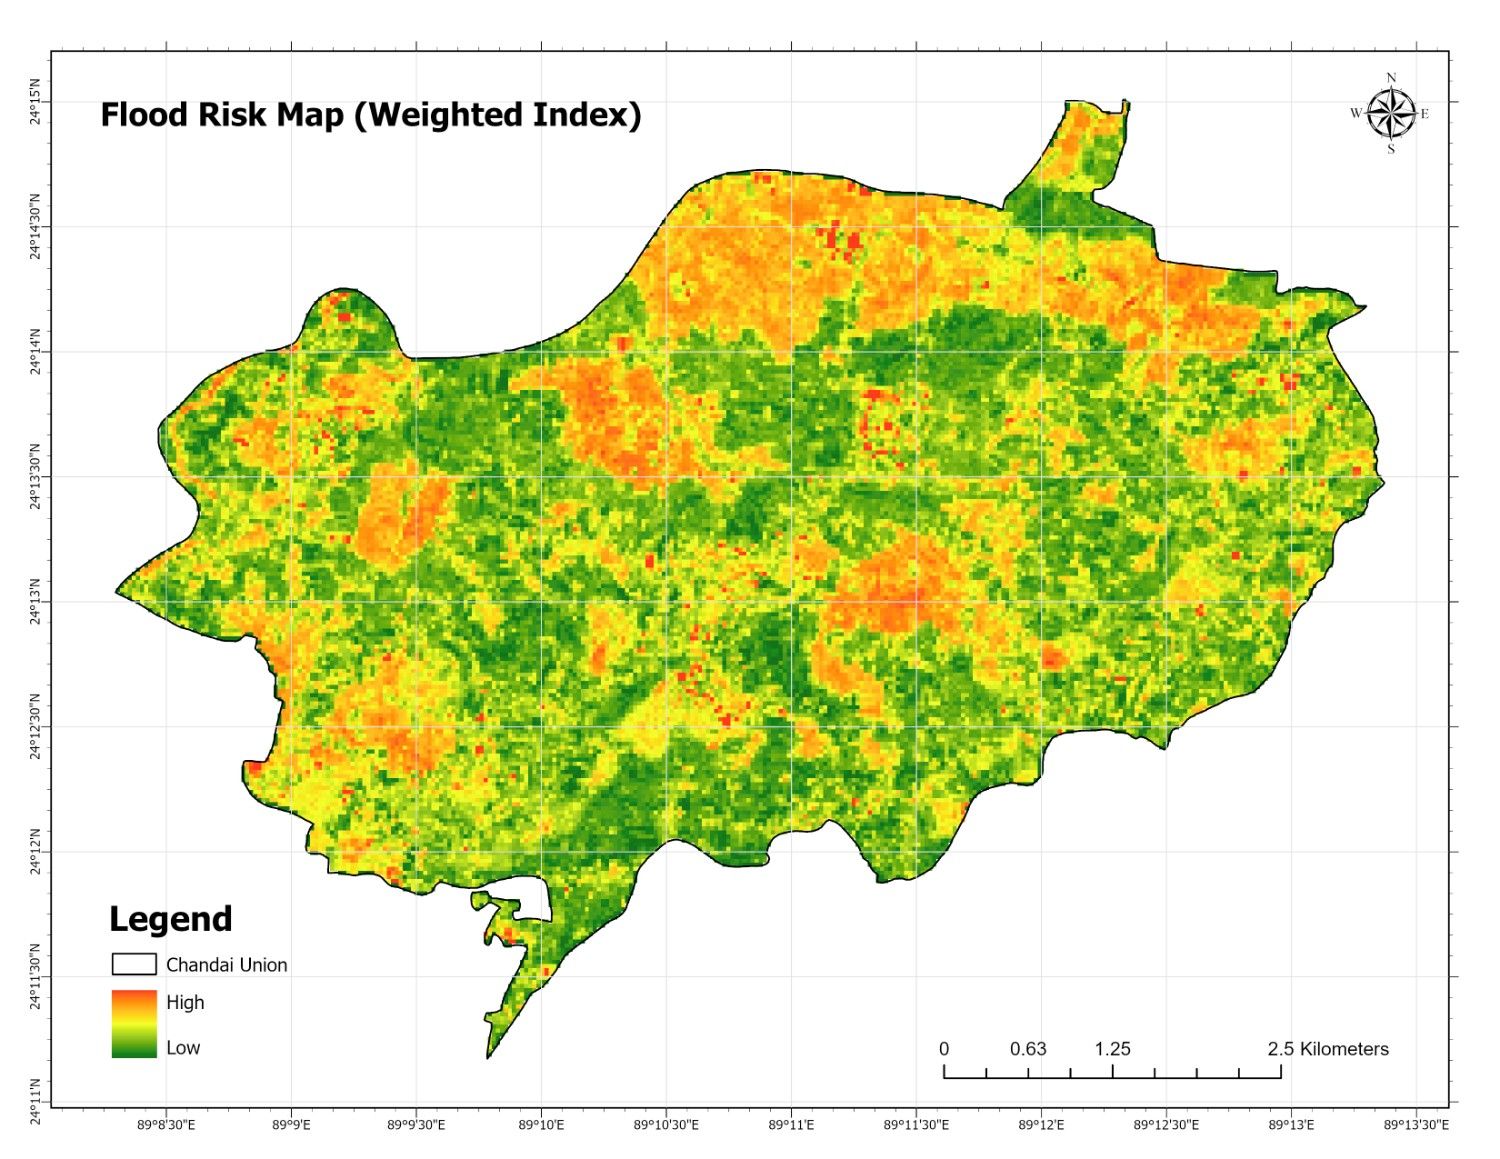
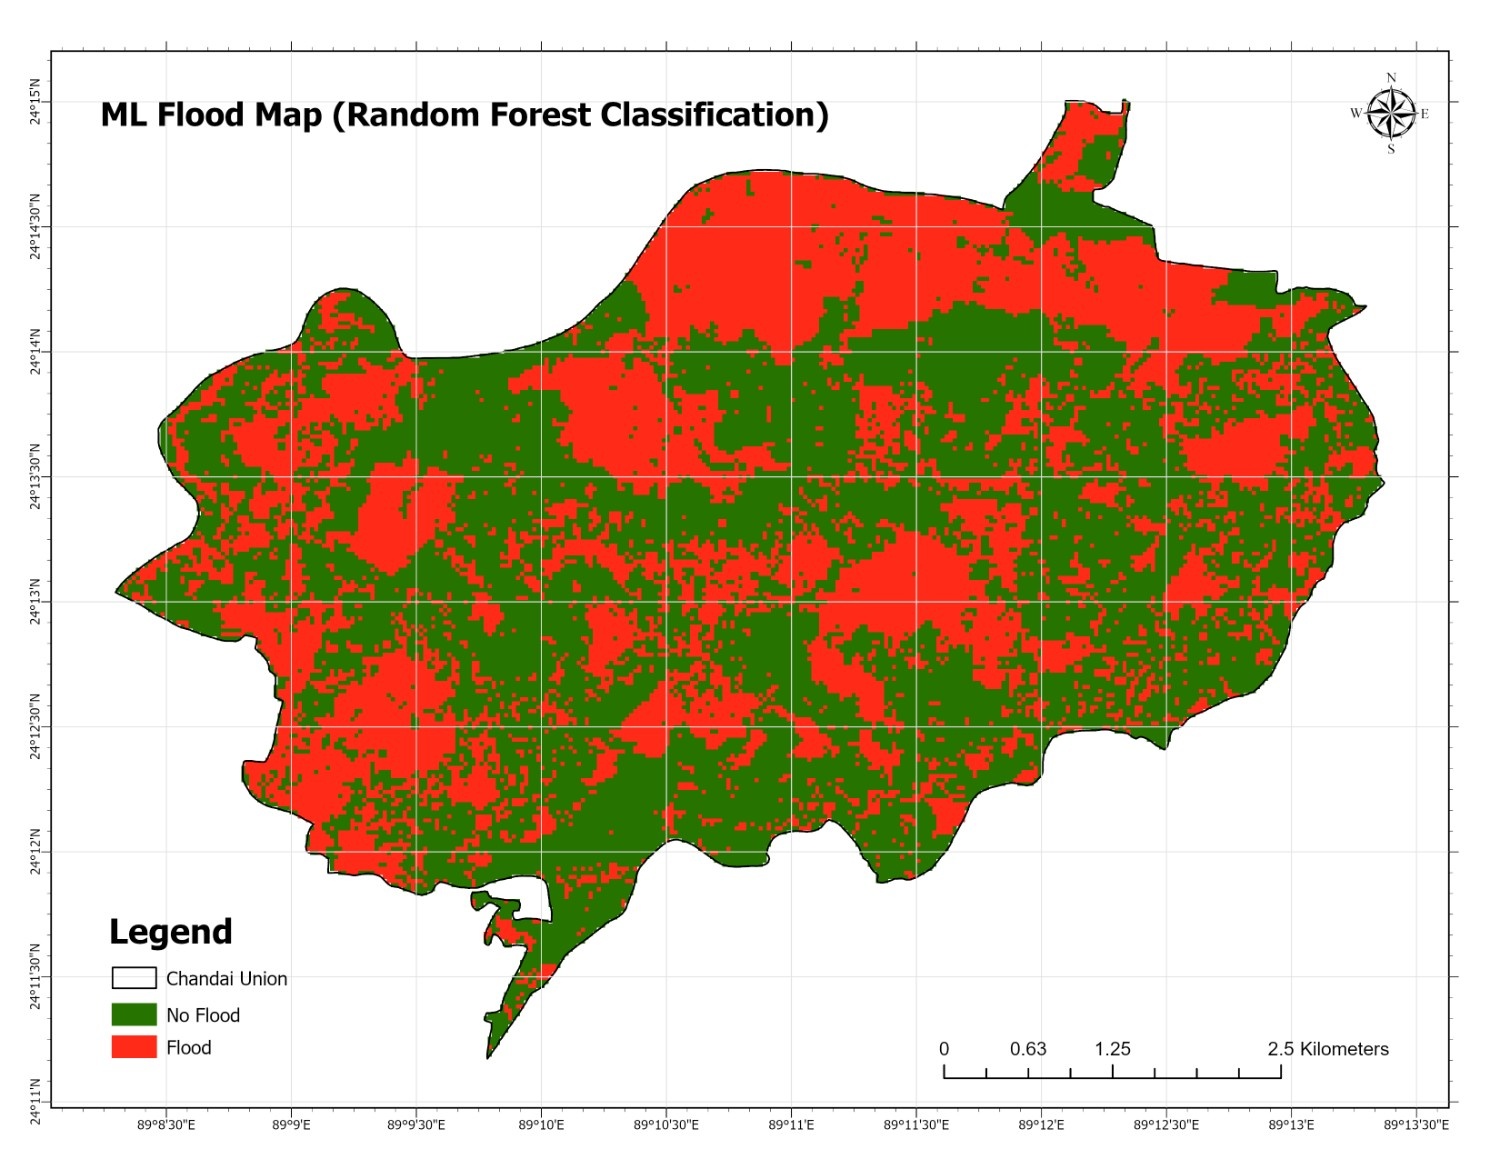
I recently completed a Flood Risk Assessment for Chandai Union,
Natore using Remote Sensing and Machine Learning. The project
integrates Sentinel-2 NDWI, SRTM DEM (elevation & slope), and
monsoon data from June to September 2023. A Weighted Overlay
Model (NDWI × 0.5, Elevation × −0.3, Slope × −0.2) was applied
along with a Random Forest Classifier (100 trees) to map
flood-prone areas. The analysis achieved an overall accuracy of
98.35%, a Kappa coefficient of 0.967, and an AUC score of 0.998,
with NDWI being the most important feature (268.99), followed by
slope and elevation, confirming that low-lying, waterlogged
areas carry the highest flood risk.
Data Analysis and Mapping by: Md Khadem Ali Tools Used: Python (Pandas, NumPy, Matplotlib, Seaborn,
GeoPandas), Google Earth Engine (JavaScript)
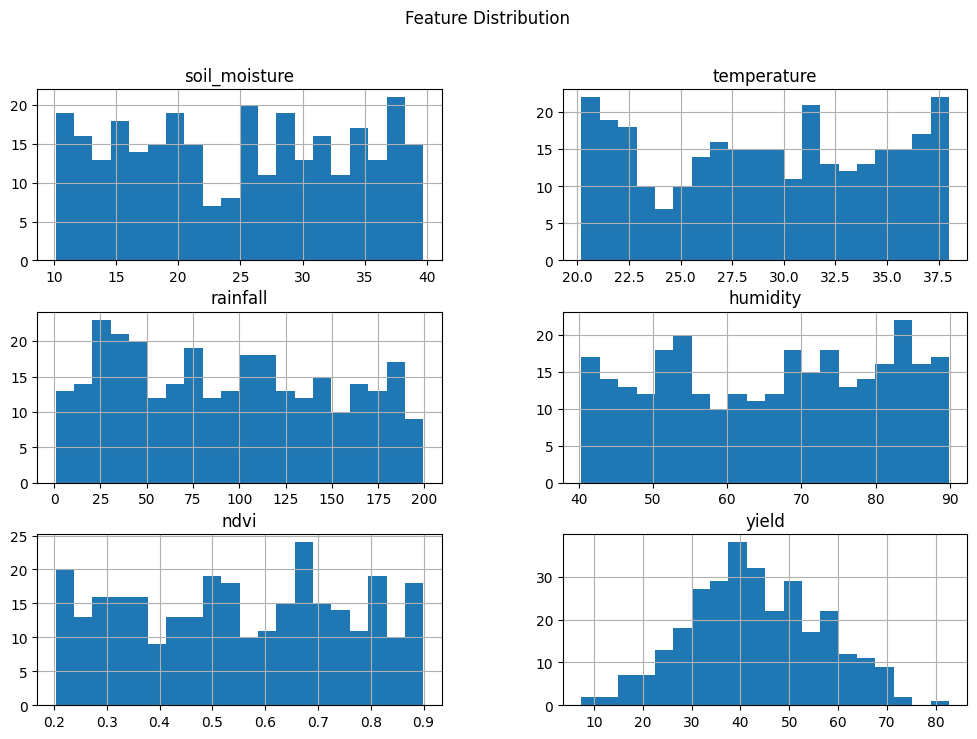
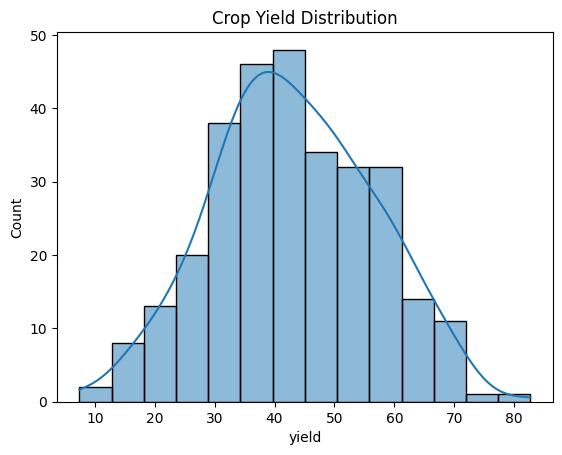
This project demonstrates how Artificial Intelligence and
Machine Learning can support Precision Agriculture and Crop
Yield Prediction. Using environmental variables like soil
moisture, temperature, rainfall, humidity, and NDVI, I developed
Random Forest models to accurately predict crop yields. The
project integrates Python and MATLAB workflows, includes
interactive visualizations, correlation analysis, feature
importance, and exploratory data analysis. The workflow provides
a research-ready framework for actionable insights in
agriculture.
Data Analysis and Mapping by: Md Khadem Ali
Tools Used: Python (Pandas, NumPy, Matplotlib, Seaborn,
GeoPandas), MATLAB
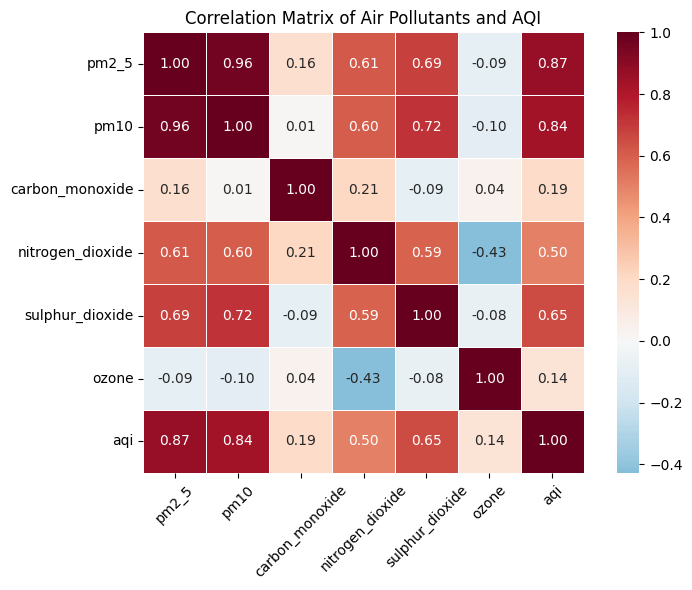
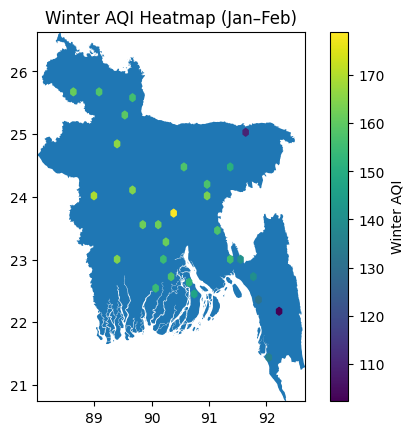
Geospatial Analysis of Air Quality in Bangladesh (2000–2025)
This project presents a comprehensive GIS-based analysis of air
quality across Bangladesh from 2000 to 2025. Hourly AQI
measurements along with key pollutants such as PM2.5, PM10, CO,
NO₂, SO₂, and O₃ were integrated into spatial heatmaps and
statistical visualizations to identify pollution hotspots,
temporal trends, and correlations among pollutants.
Data Analysis and Mapping by: Md Khadem Ali
Data Source: National Air Quality Monitoring Dataset
(2000–2025)
Tools Used: Python (Pandas, GeoPandas, Matplotlib, Seaborn)
Coordinate System: WGS 1984 / EPSG:4326
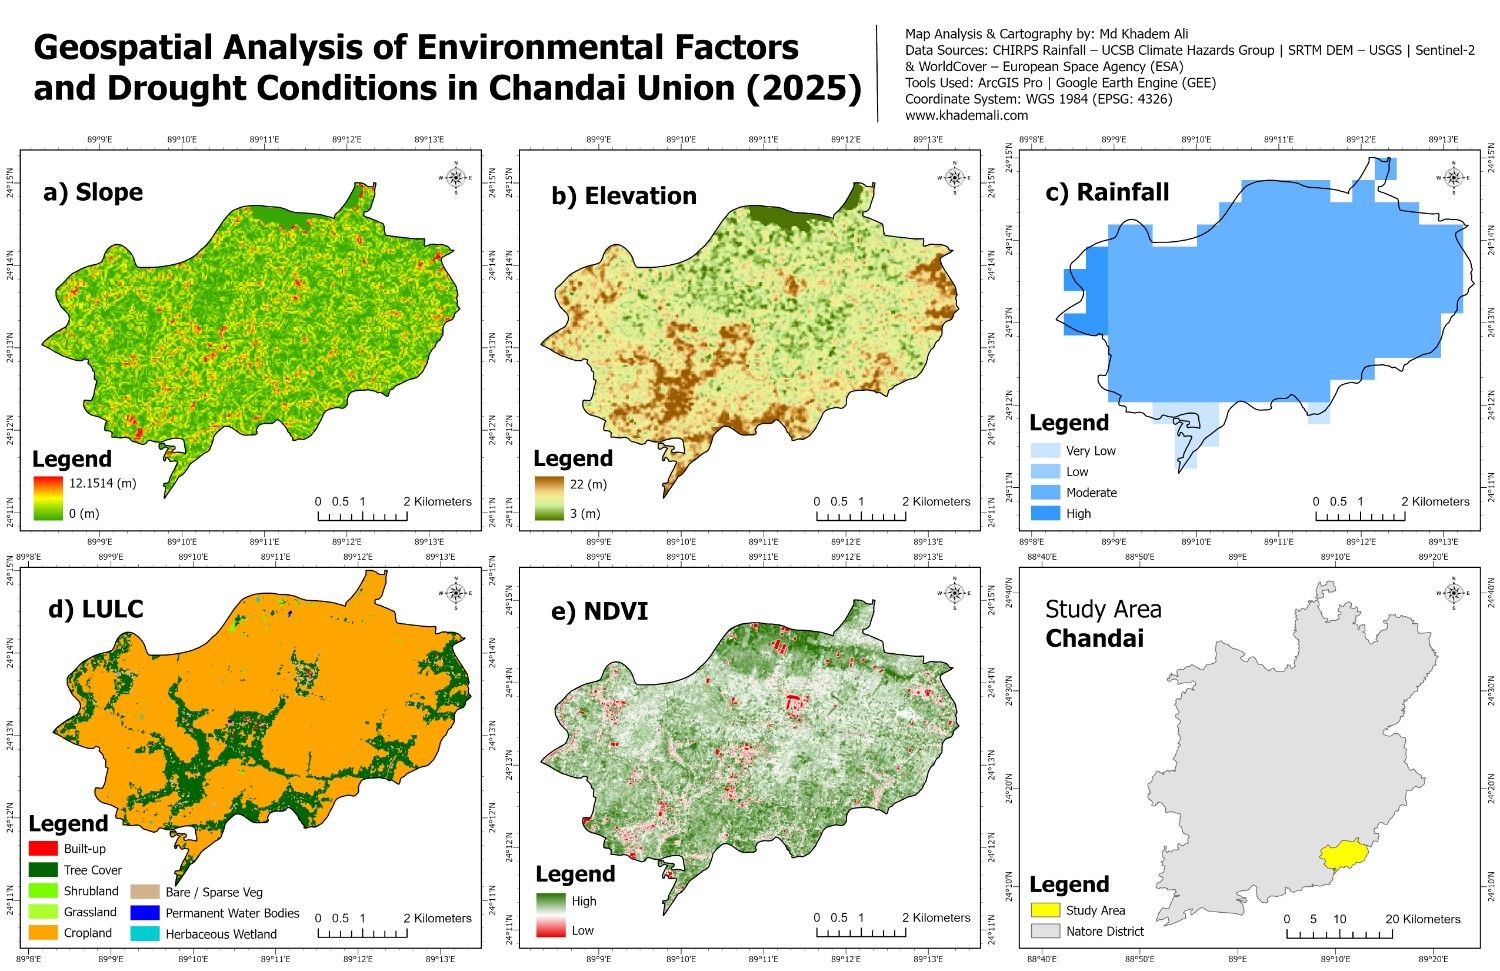
Geospatial Analysis of Environmental Factors and Drought
Conditions in Chandai Union (2025)
This project presents a GIS-based environmental and drought
assessment of Chandai Union (2025). Annual rainfall derived from
CHIRPS data was classified to identify drought zones, while
elevation, slope, NDVI, and land use/land cover (LULC) layers
were integrated to analyze environmental variability and spatial
patterns. The study highlights the relationship between rainfall
distribution, vegetation health, terrain characteristics, and
drought vulnerability within the study area.
Map Analysis and Cartography by: Md Khadem Ali
Data Source: CHIRPS Rainfall, SRTM DEM, Sentinel-2 NDVI, ESA
WorldCover
Tools Used: Google Earth Engine, ArcGIS Pro
Coordinate System: WGS 1984 / EPSG:4326
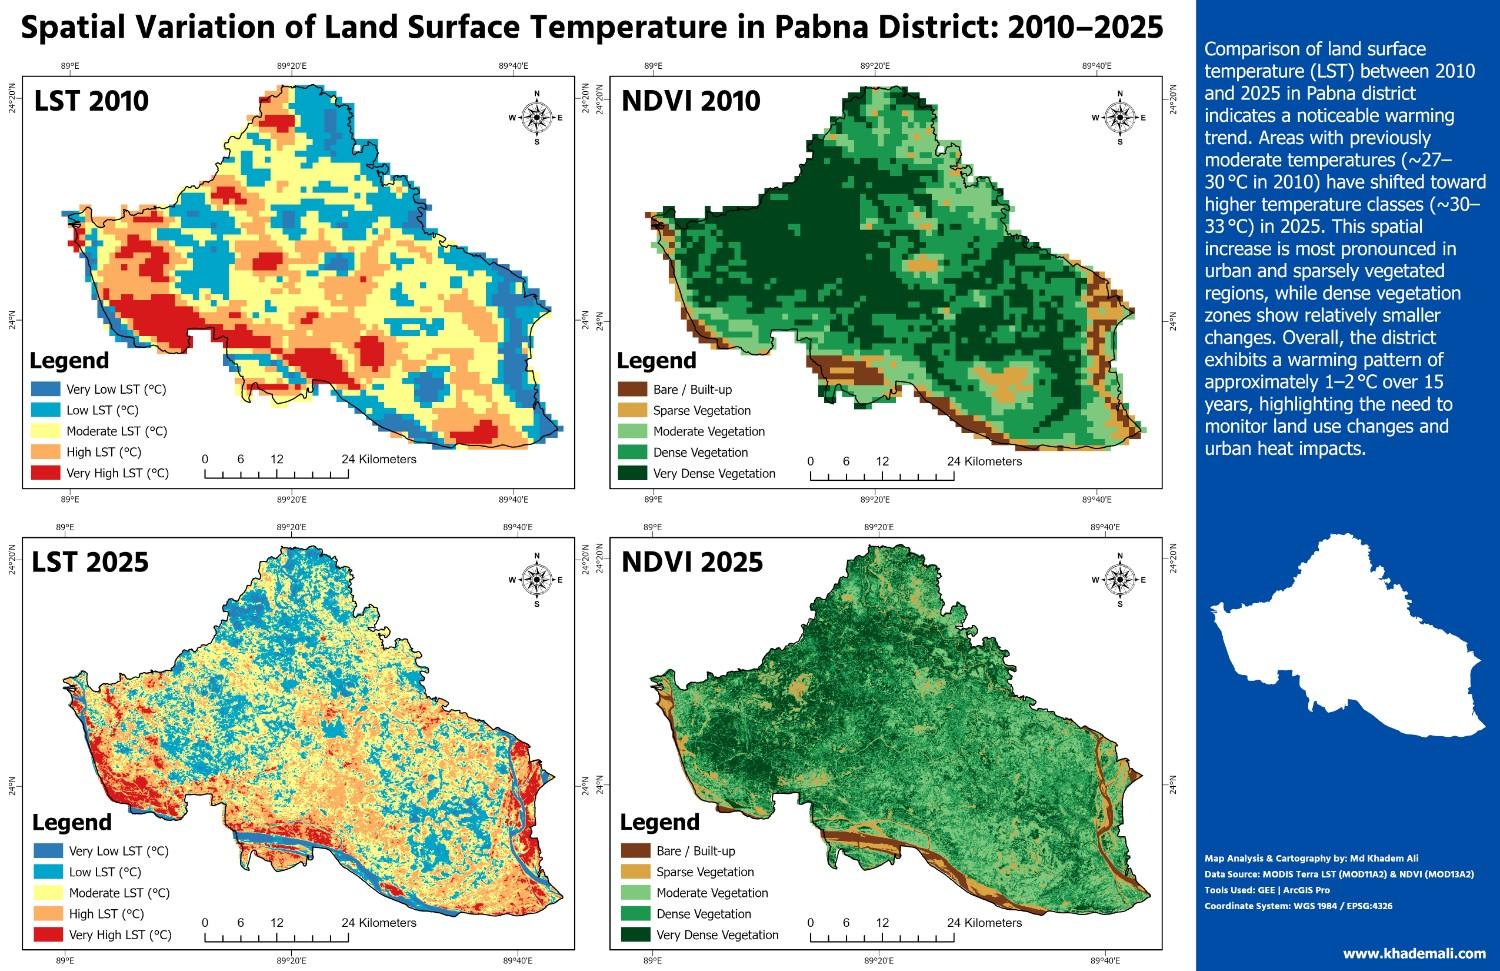
Spatial Variation of Land Surface Temperature in Pabna District:
2010–2025
This project examines the spatial and temporal variations of
land surface temperature (LST) in Pabna District from 2010 to
2025. MODIS Terra LST data were processed in Google Earth Engine
to produce annual mean rasters, while NDVI was derived to assess
vegetation influence on surface temperature. The analysis
highlights a clear warming trend in urban and sparsely vegetated
areas, whereas regions with dense vegetation experienced
comparatively smaller temperature increases, revealing the
impact of land cover on local thermal dynamics.
Map Analysis and Cartography by: Md Khadem Ali
Data Source: MODIS Terra LST (MOD11A2) & NDVI (MOD13A2)
Tools Used: Google Earth Engine, ArcGIS Pro
Coordinate System: WGS 1984 / EPSG:4326
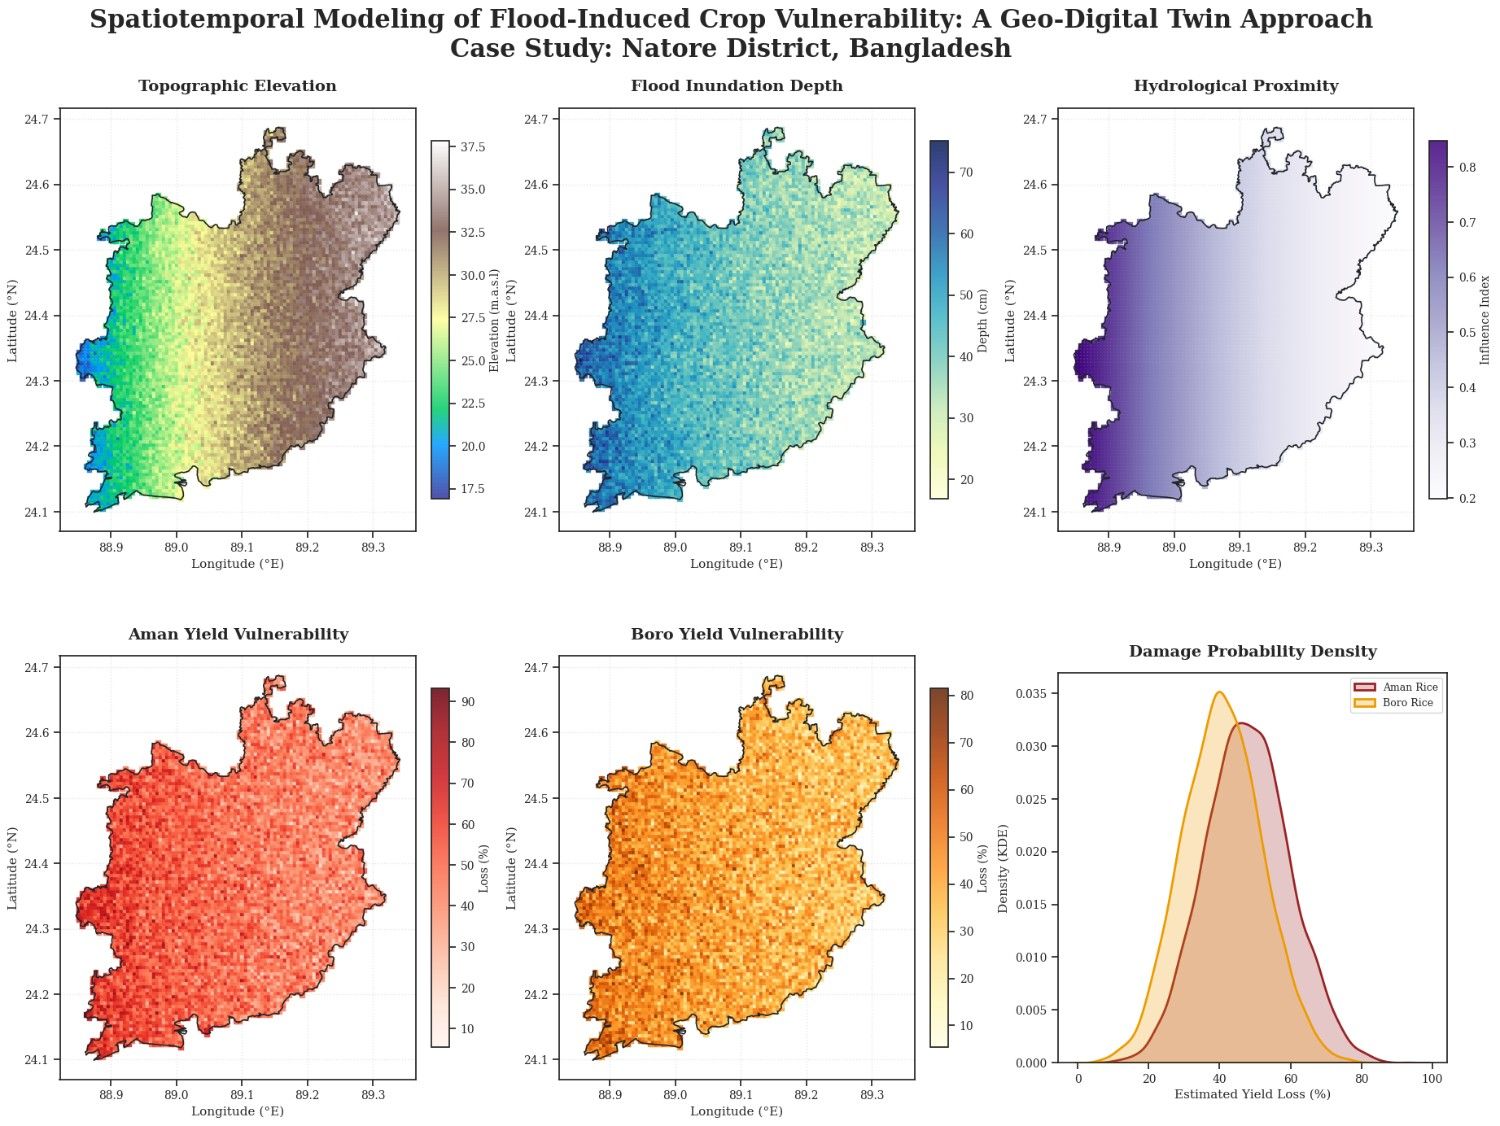
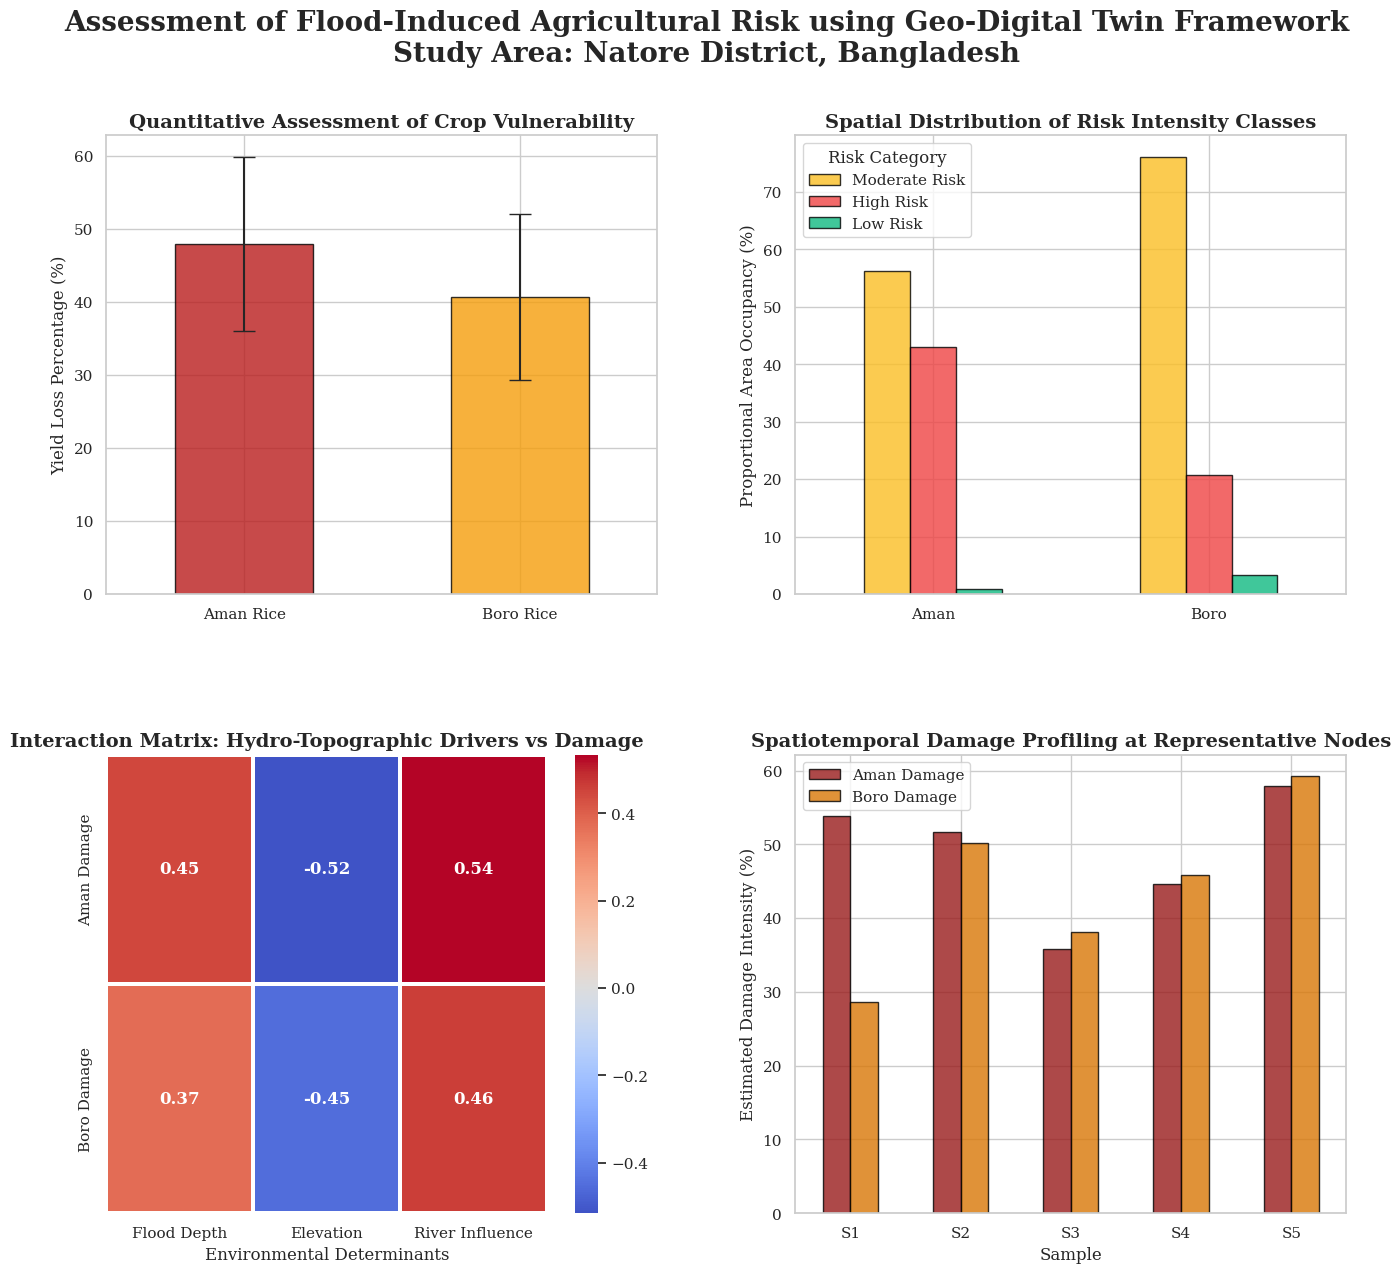
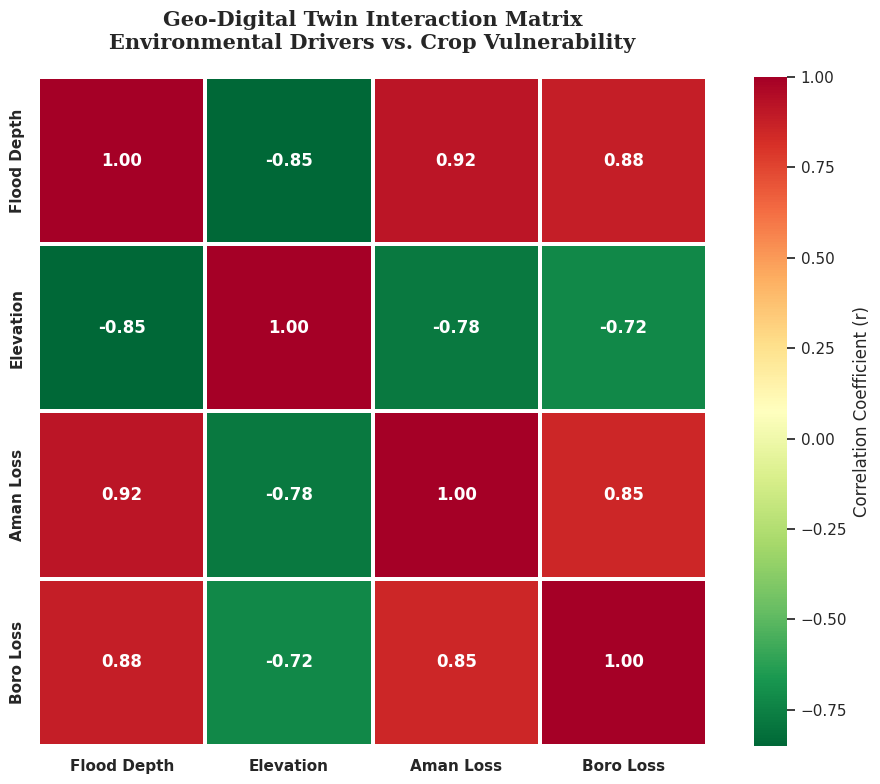
Spatiotemporal Modeling of Flood-Induced Crop Vulnerability: A
Geo-Digital Twin Approach (Case Study: Natore District, Bangladesh)
This project represents my independent work on assessing
flood-induced vulnerability of Aman and Boro rice crops in
Natore District, Bangladesh. I developed a Geo-Digital Twin
framework that combines synthetic environmental modeling
(elevation, river influence, flood depth) with statistical crop
damage simulations to quantify risk levels across the district.
The analysis revealed that Aman rice exhibits an average yield
loss of 47.85% (Std. Dev: 11.91%, Min: 4.55%, Max: 95.31%),
while Boro rice shows an average loss of 40.60% (Std. Dev:
11.38%, Min: 0.95%, Max: 83.97%). The workflow includes
generating a high-resolution spatial grid, modeling river
influence on flood dynamics, simulating topographic elevation,
estimating flood depth, and predicting yield losses for both
Aman and Boro rice. Risk classification indicated that 42.01% of
Aman rice areas and 20.25% of Boro rice areas fall under High
Risk, while 57.22% of Aman and 76.49% of Boro rice areas are
under Moderate Risk, and only a small fraction (0.77% for Aman,
3.26% for Boro) are at Low Risk. Correlation analysis showed
that flood depth (Aman: 43.7%, Boro: 40.6%) and river influence
(Aman: 52.7%, Boro: 48.6%) positively drive crop damage, while
elevation is negatively correlated (Aman: -51.1%, Boro: -47.4%).
Spatiotemporal visualizations, including maps, heatmaps, and
proportional risk charts, were independently produced using
Python libraries (GeoPandas, Matplotlib, Seaborn, Pandas,
NumPy). This project demonstrates my ability to integrate
geospatial analysis, statistical modeling, and data
visualization into a coherent, research-grade framework for
actionable flood risk assessment in agriculture.
Data Source: GADM shapefiles for Natore District, synthetic
data for flood and crop modeling
Tools Used: Python (GeoPandas, Matplotlib, Seaborn, Pandas,
NumPy)
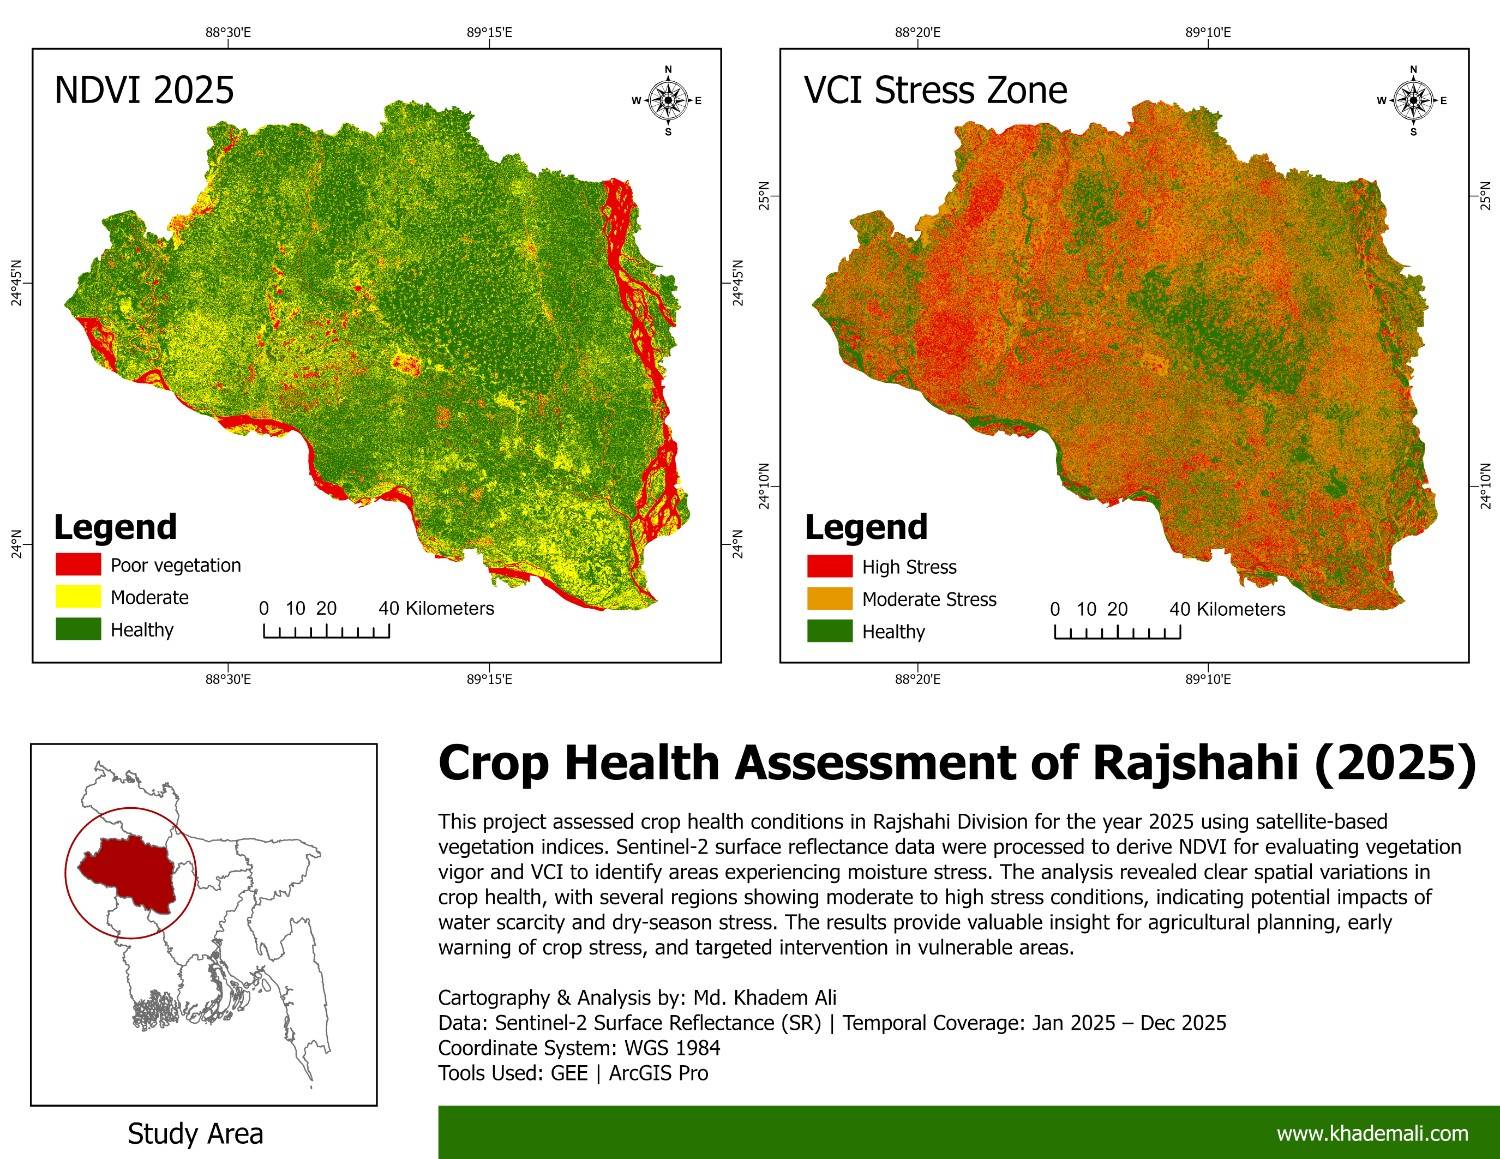
Crop Health Assessment of Rajshahi Division (2025)
This project evaluates crop health conditions across Rajshahi
Division for the year 2025 using satellite-based vegetation
indices. Sentinel-2 surface reflectance imagery was processed to
derive NDVI for assessing vegetation vigor and the Vegetation
Condition Index (VCI) for identifying crop stress related to
moisture deficiency. The results reveal distinct spatial
patterns of healthy and stressed croplands, providing valuable
insights for agricultural planning and early warning of
drought-prone areas.
Data Source: Sentinel-2 SR (ESA)
Tools: Google Earth Engine, ArcGIS Pro
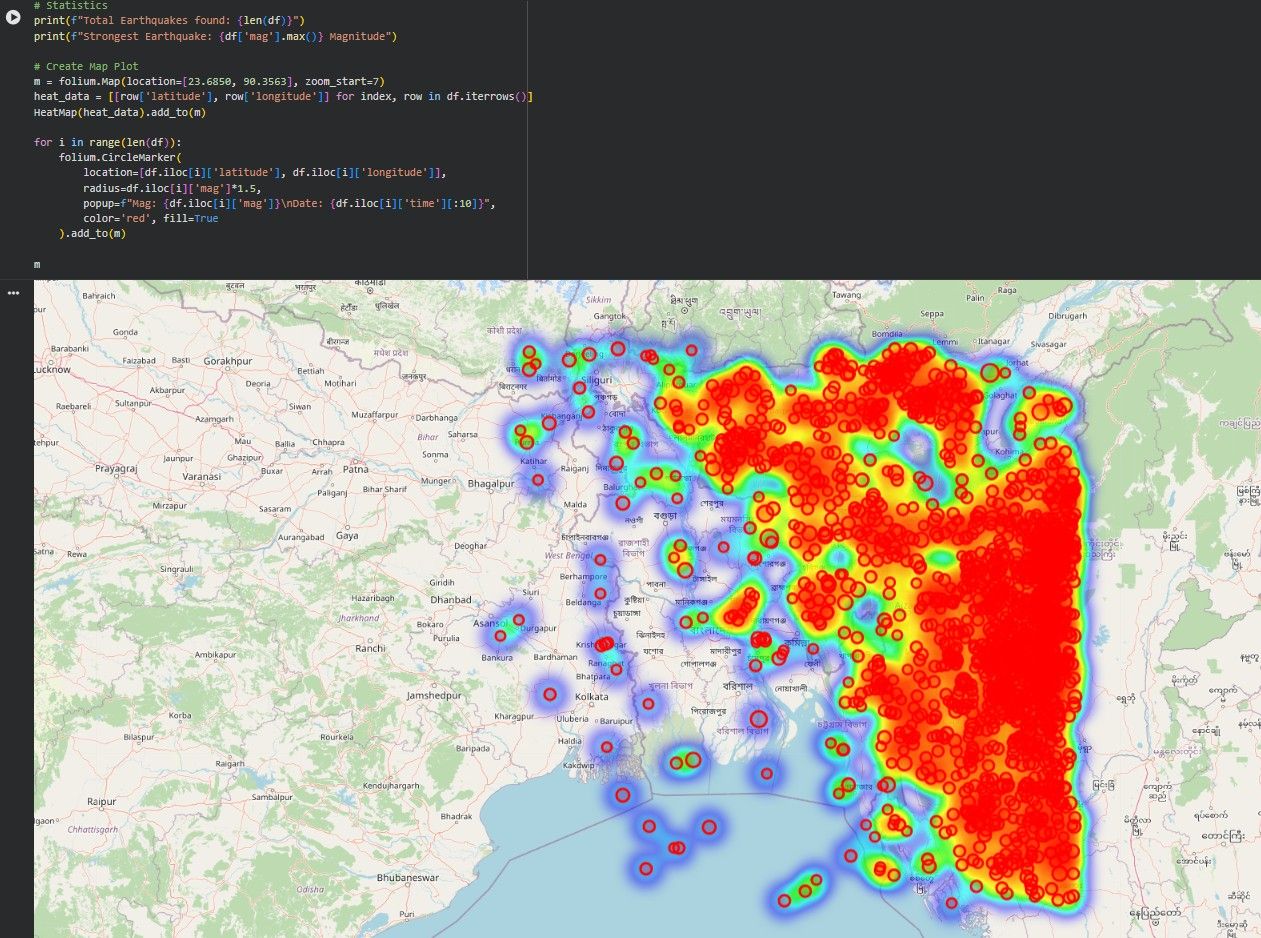
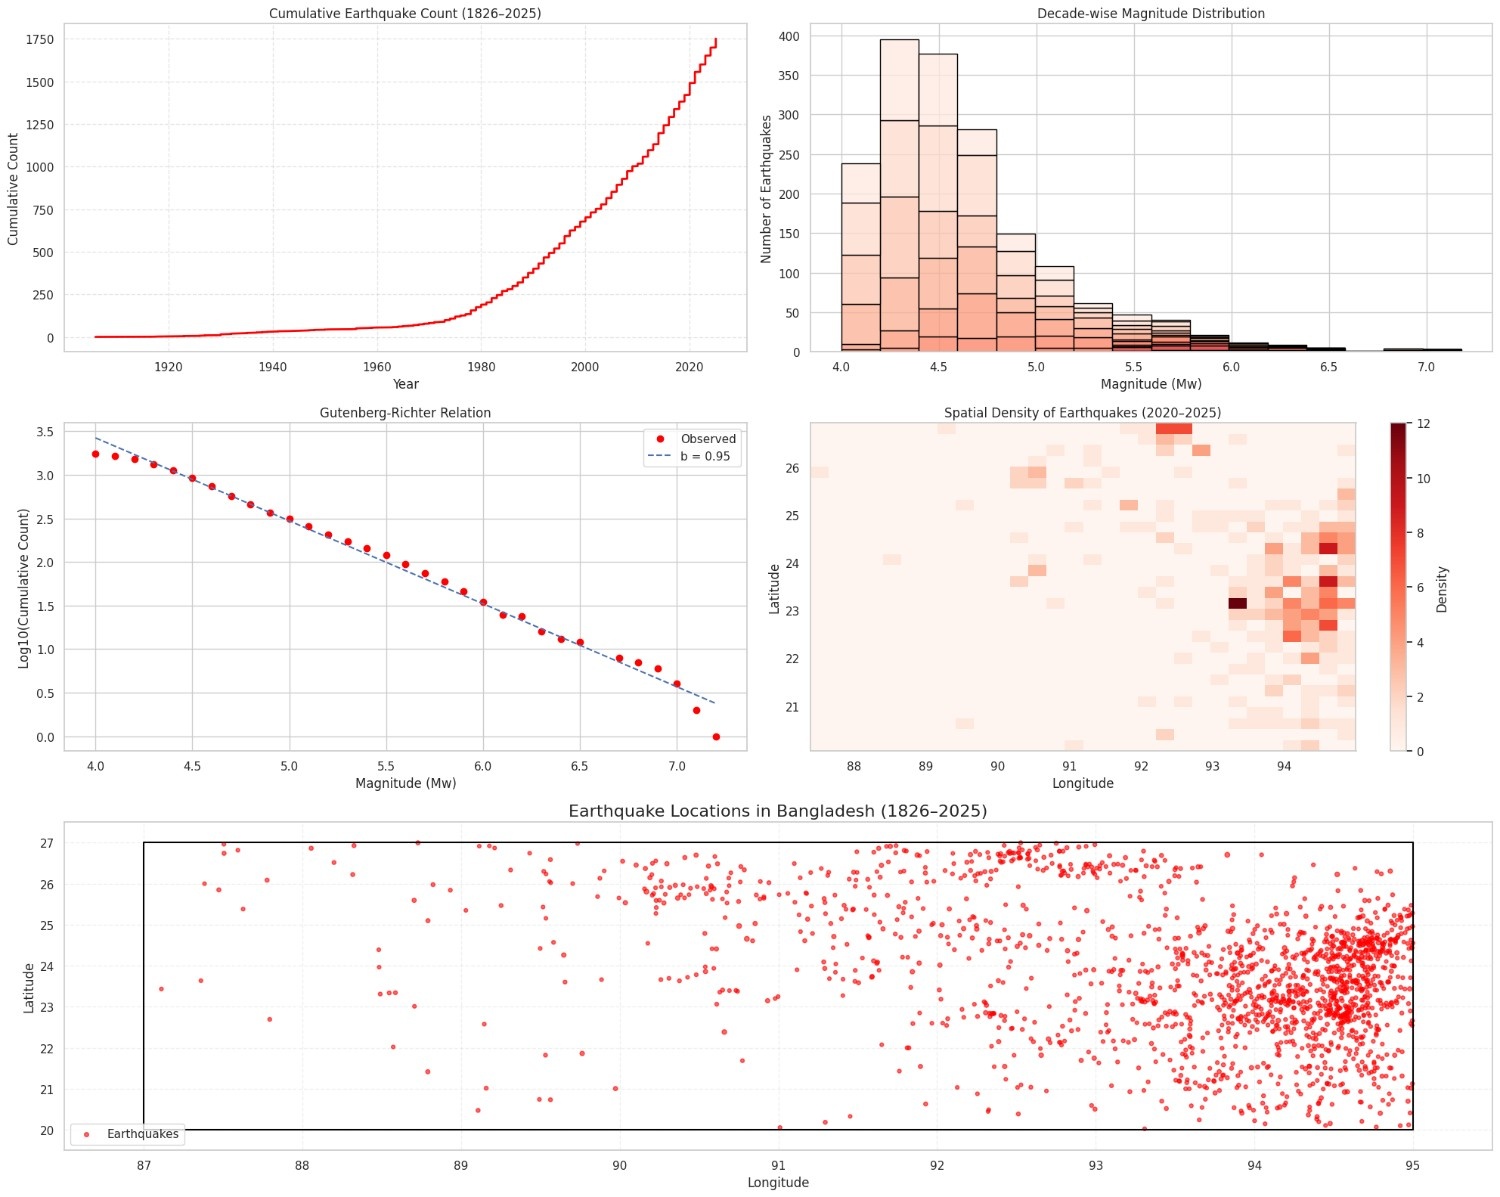
Spatio-Temporal Analysis of Earthquakes in Bangladesh
(1826–2025)
The "Spatio-Temporal Analysis of Earthquakes in Bangladesh
(1826–2025)" project, conducted by Md Khadem Ali, provides a
comprehensive 200-year overview of seismic activity across
Bangladesh. Using USGS earthquake records and geospatial
visualization techniques, this project maps all recorded
earthquakes, showing both magnitude and spatial distribution.
The interactive map and heatmaps highlight high-density seismic
zones, while decade-wise animations and magnitude-frequency
analyses facilitate research-driven insights into temporal
trends and risk assessment. This visualization supports disaster
preparedness, research, and educational purposes, with clear
markers, color-coded magnitude scales, and an intuitive layout
for professional presentation.
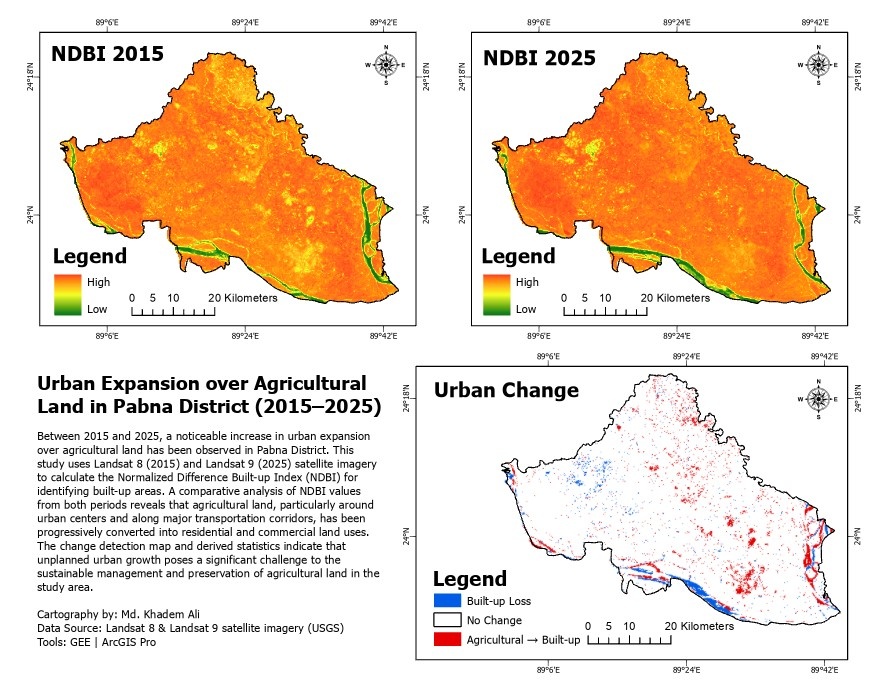
Urban Expansion over Agricultural Land in Pabna District
(2015–2025)
This project analyzes the conversion of agricultural land into
built-up areas in Pabna District between 2015 and 2025 using
satellite-based change detection techniques. Landsat 8 and
Landsat 9 imagery were processed to compute the Normalized
Difference Built-up Index (NDBI), enabling the identification of
urban expansion patterns. The results show a noticeable increase
in built-up areas, particularly around urban centers and major
transportation corridors, highlighting the pressure of unplanned
urbanization on agricultural land.
Data Source: Landsat 8 & Landsat 9 (USGS)
Tools: Google Earth Engine, ArcGIS Pro
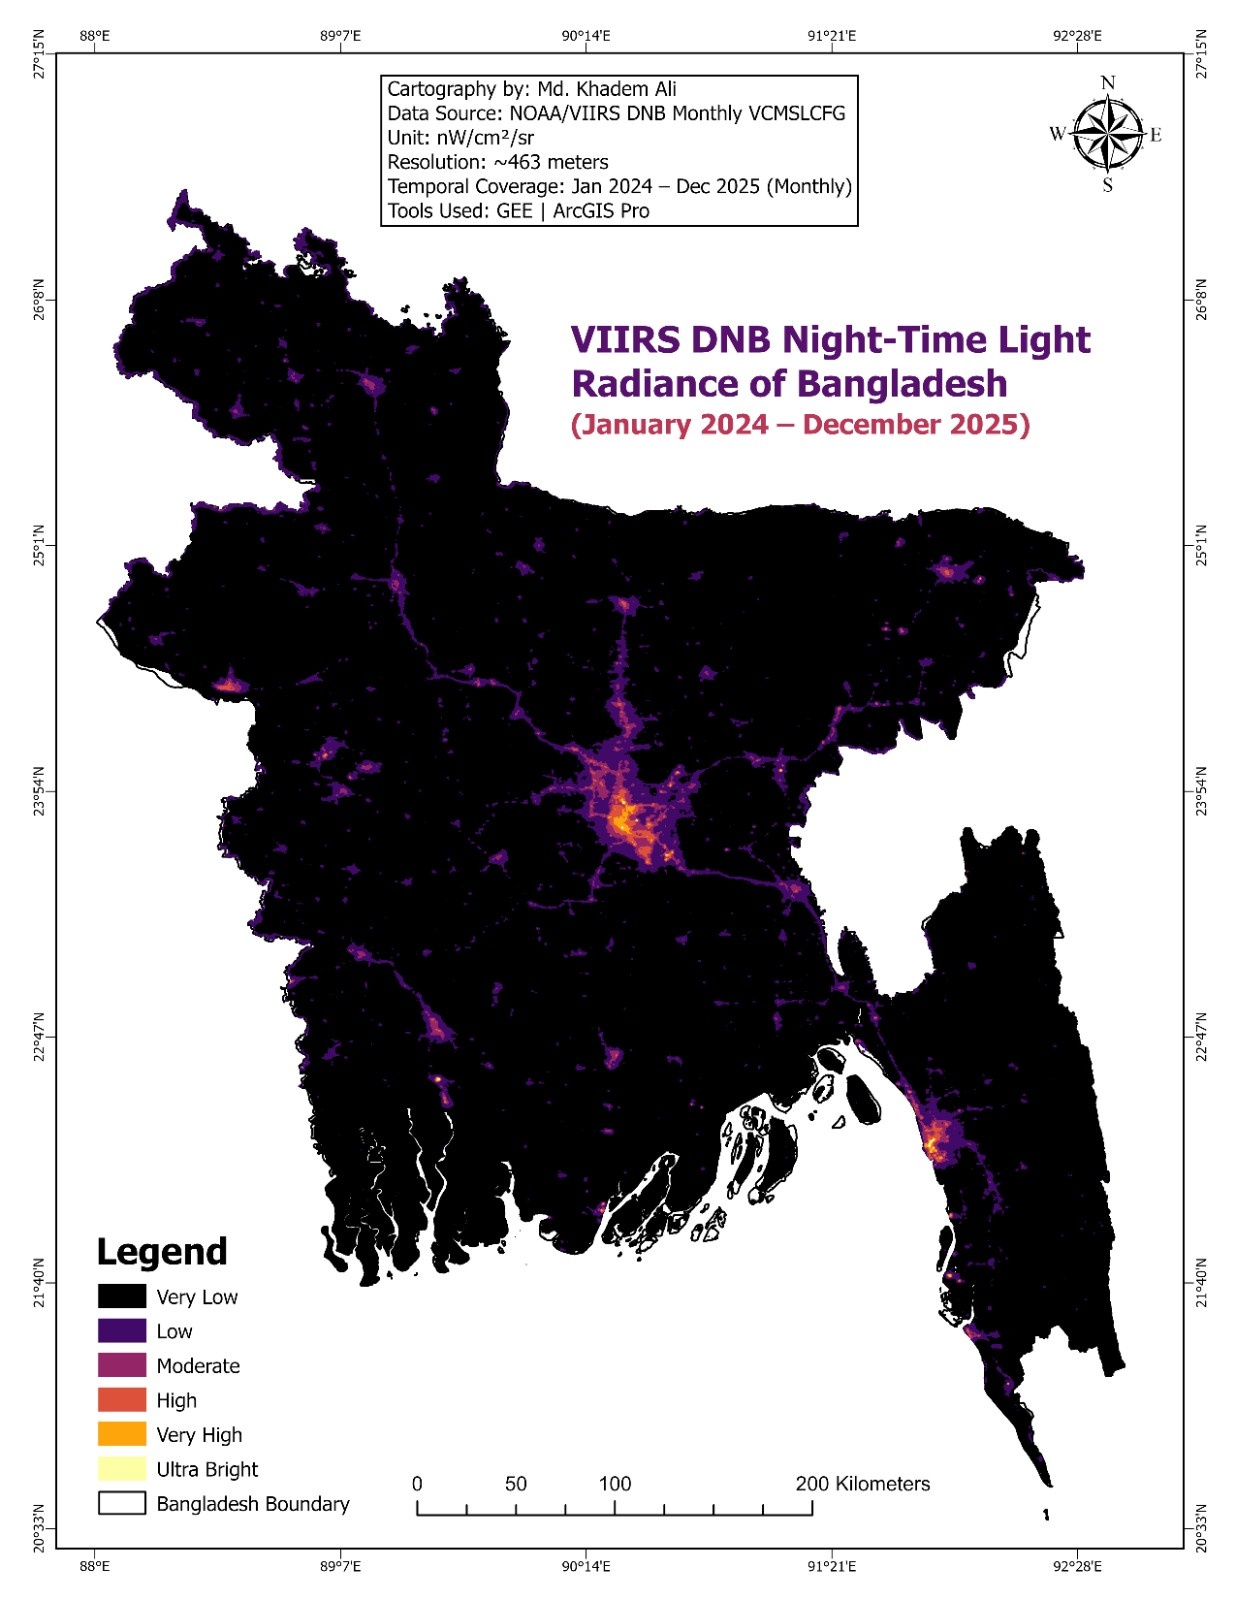
VIIRS DNB Night-Time Light Radiance of Bangladesh (2024–2025)
This project maps annual night-time light pollution across
Bangladesh using the VIIRS DNB monthly radiance dataset for the
period January 2024 – December 2025. The study highlights urban
and rural light intensity differences and identifies major urban
hubs like Dhaka and Chattogram. This analysis supports
applications in urban monitoring, environmental planning, and
assessing the spatial extent of artificial lighting.
Data Source: VIIRS DNB (NASA/NOAA)
Tools: Google Earth Engine, ArcGIS Pro
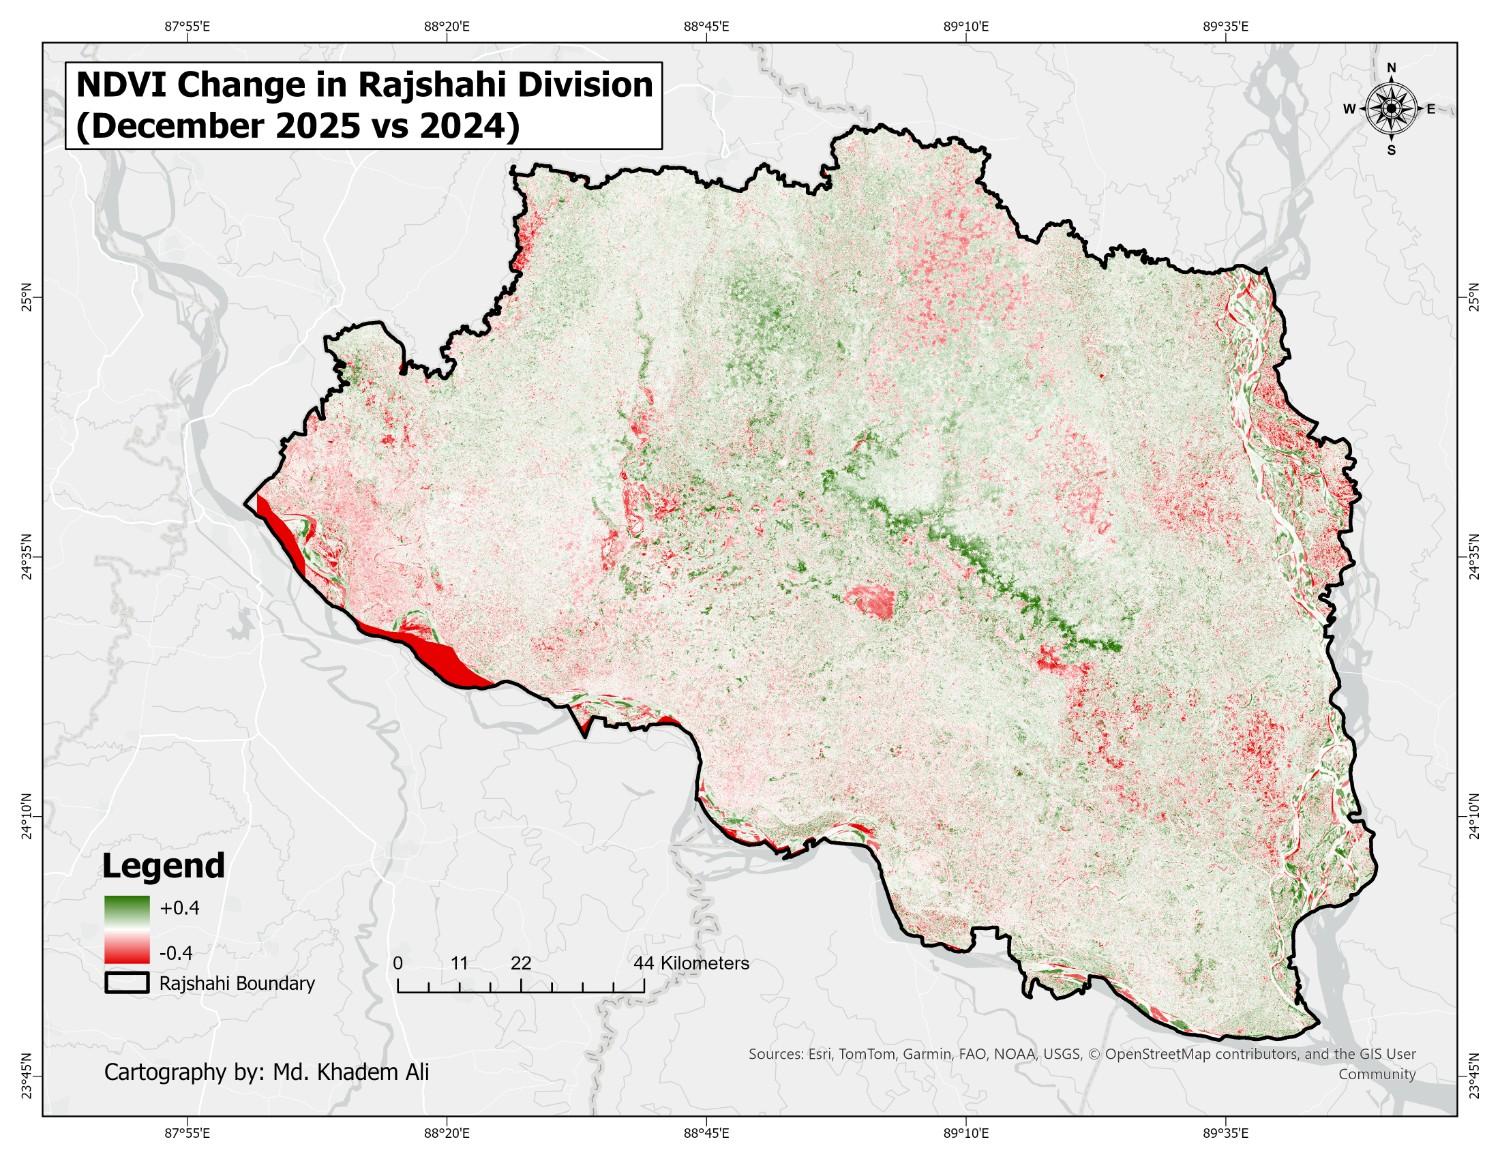
Winter Vegetation Change in Rajshahi Division (December
2024–2025)
This project analyzes winter vegetation change in Rajshahi
Division, Bangladesh using Sentinel-2 Surface Reflectance data.
Conducted by me, Md Khadem Ali, the study computes NDVI for
December 2024 and December 2025, applies cloud masking with the
Scene Classification Layer (SCL), and generates median
composites in Google Earth Engine (GEE). Vegetation dynamics
were quantified using ΔNDVI (NDVI₍2025₎ − NDVI₍2024₎),
highlighting areas of vegetation gain and loss. The resulting
GeoTIFFs were visualized and analyzed in ArcGIS Pro using a
diverging color palette to clearly depict regions of decline
(red), stability (white), and increase (green/blue).
Data Source: Sentinel-2 SR (NASA / ESA)
Tools: Google Earth Engine, ArcGIS Pro
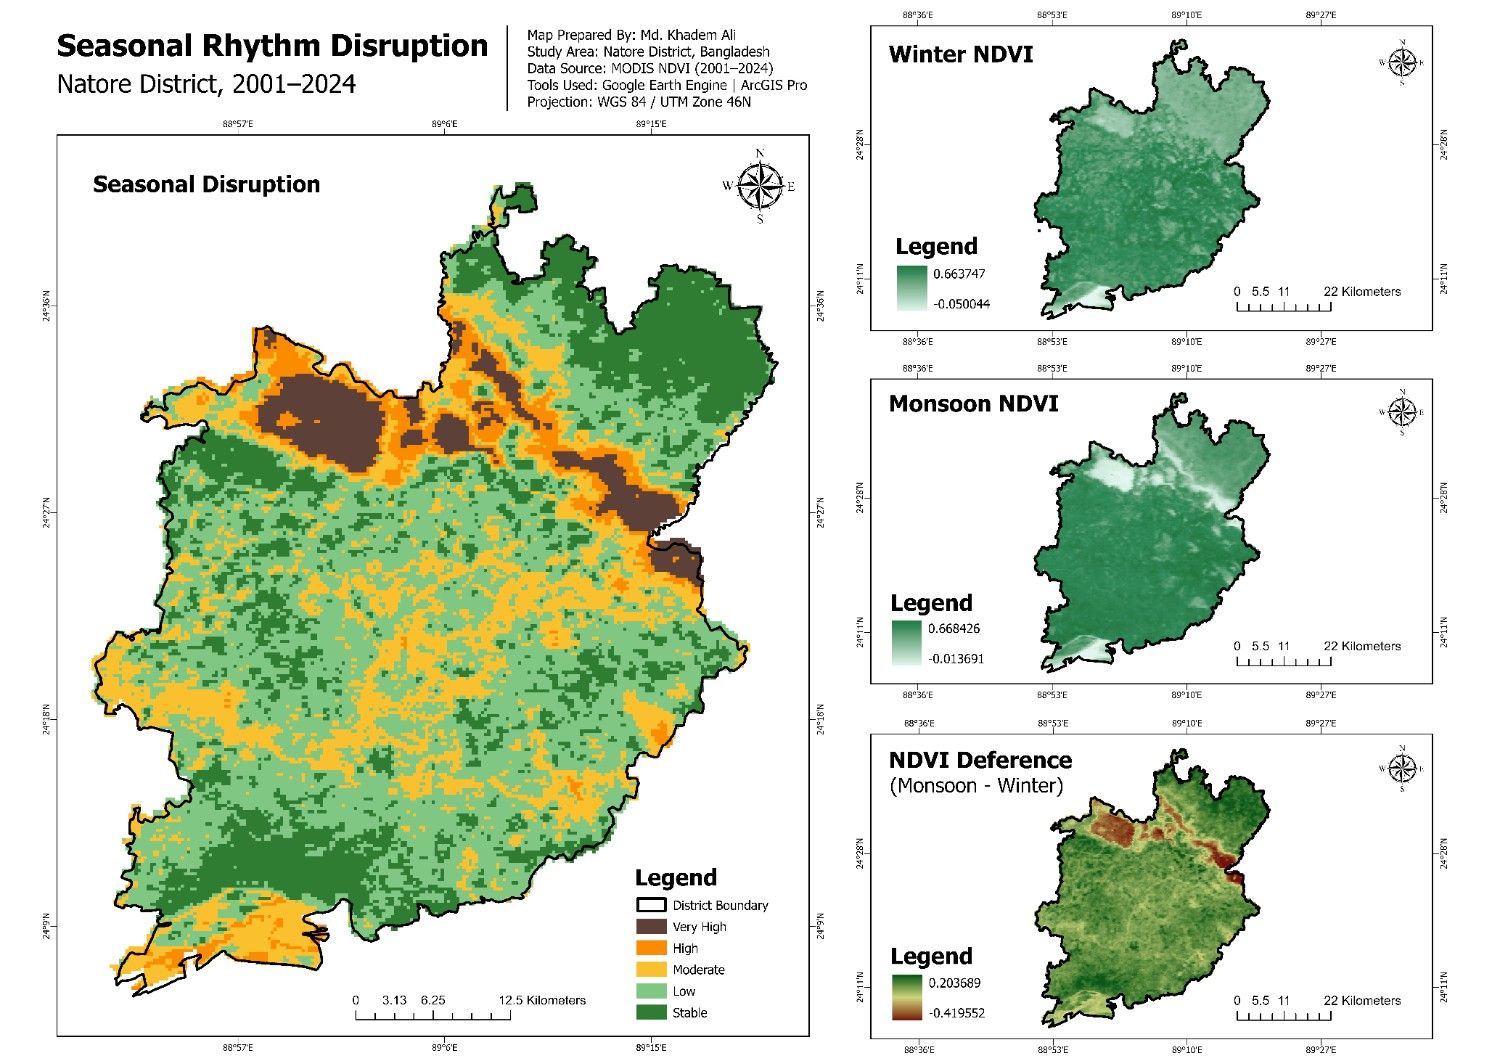
This project, Seasonal Disruption Mapping of Natore District,
was conducted by me, Md Khadem Ali, using Google Earth Engine
(GEE) and ArcGIS Pro. The study analyzes long-term vegetation
seasonality changes from 2001 to 2024 using MODIS-derived NDVI
data. Seasonal vegetation dynamics were examined separately for
winter and monsoon periods and combined to assess the degree of
seasonal rhythm disruption across the district.
The final output classifies Natore into five disruption levels,
Very High, High, Moderate, Low, and Stable,
highlighting areas where natural seasonal patterns have weakened
significantly. Supporting maps of Winter NDVI, Monsoon NDVI, and
NDVI Difference (Monsoon − Winter) were used to validate spatial
consistency. This analysis supports applications in climate
impact assessment, agricultural monitoring, and regional
environmental planning.
Data Source: MODIS NDVI (NASA)
Tools: Google Earth Engine, ArcGIS Pro
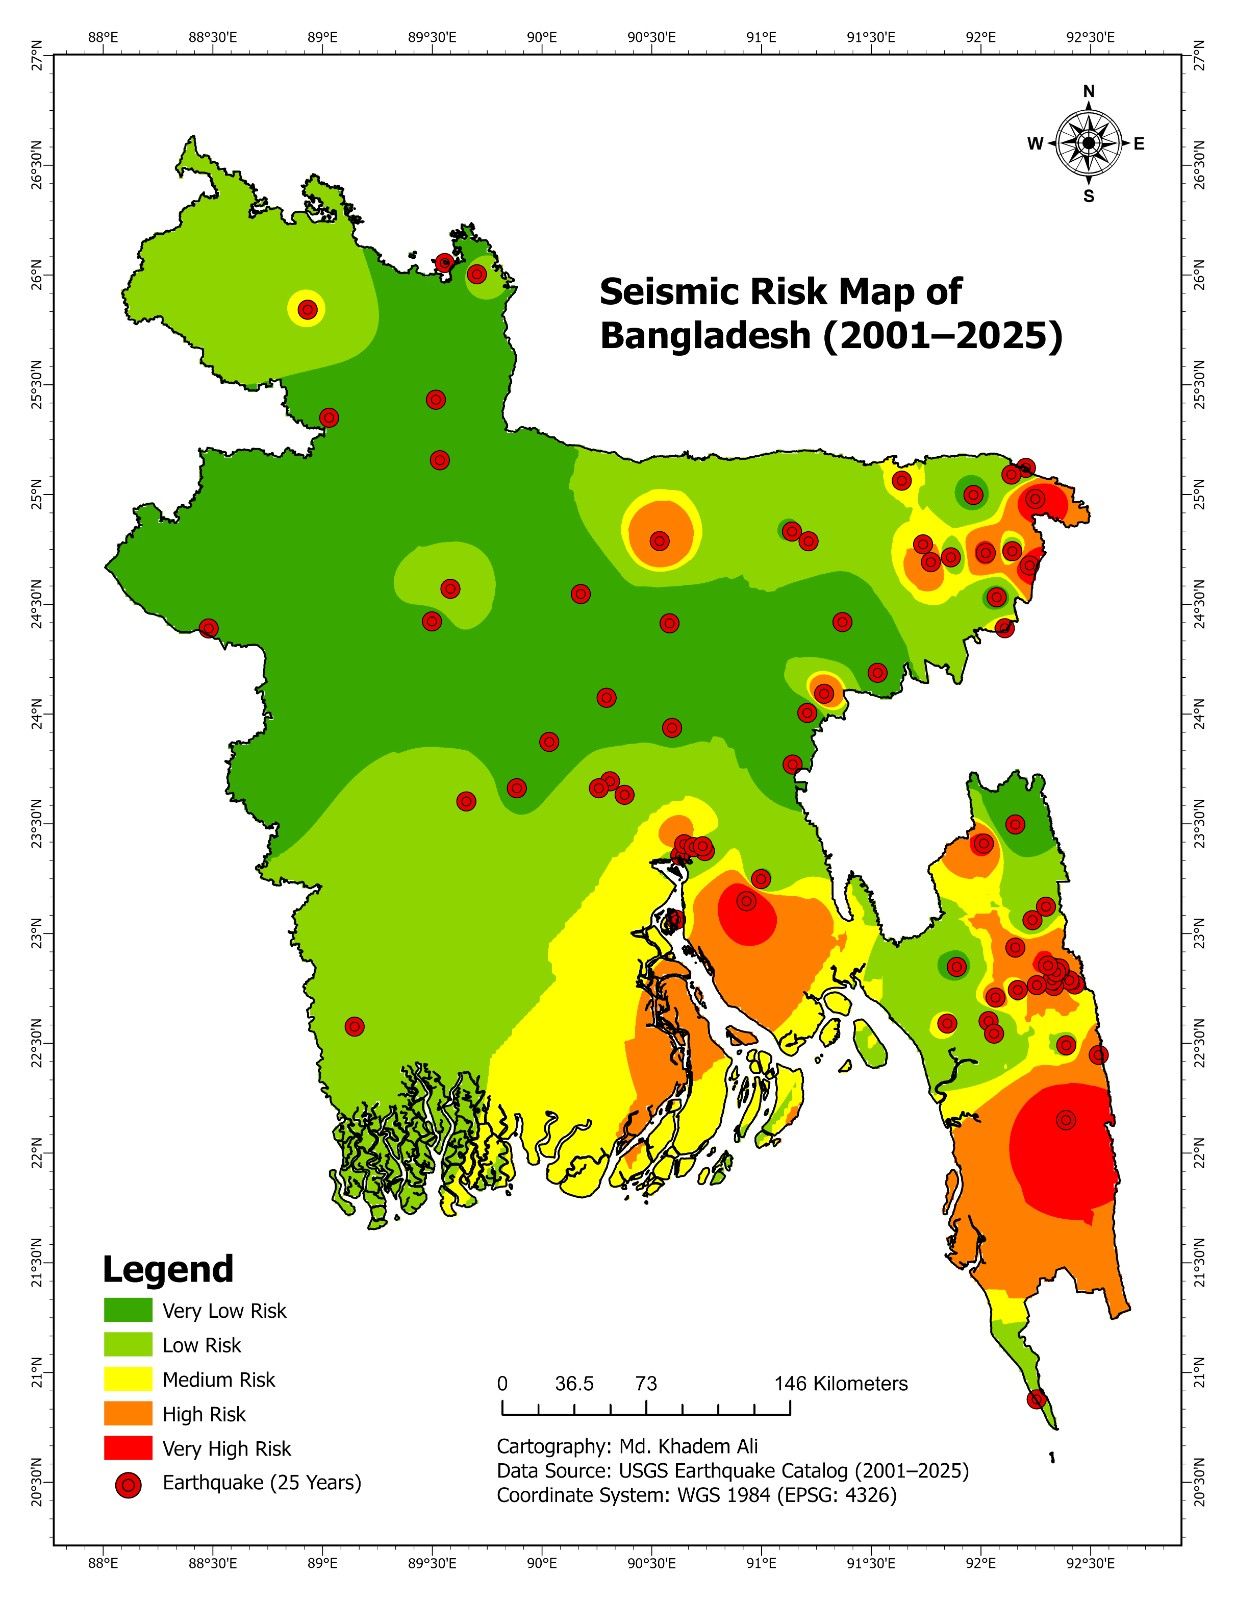
The project titled "Seismic Risk Map of Bangladesh (2001-2025)"
was created by me, Md Khadem Ali, using ArcGIS Pro. This project
visualizes the earthquake vulnerability of Bangladesh over the
last 25 years, highlighting areas ranging from very low to very
high seismic risk. By presenting earthquake data in a clear and
structured way, the map provides valuable insights into the
spatial distribution of seismic activity across the country.
Data Source: USGS Earthquake Catalog | Software: ArcGIS
Pro
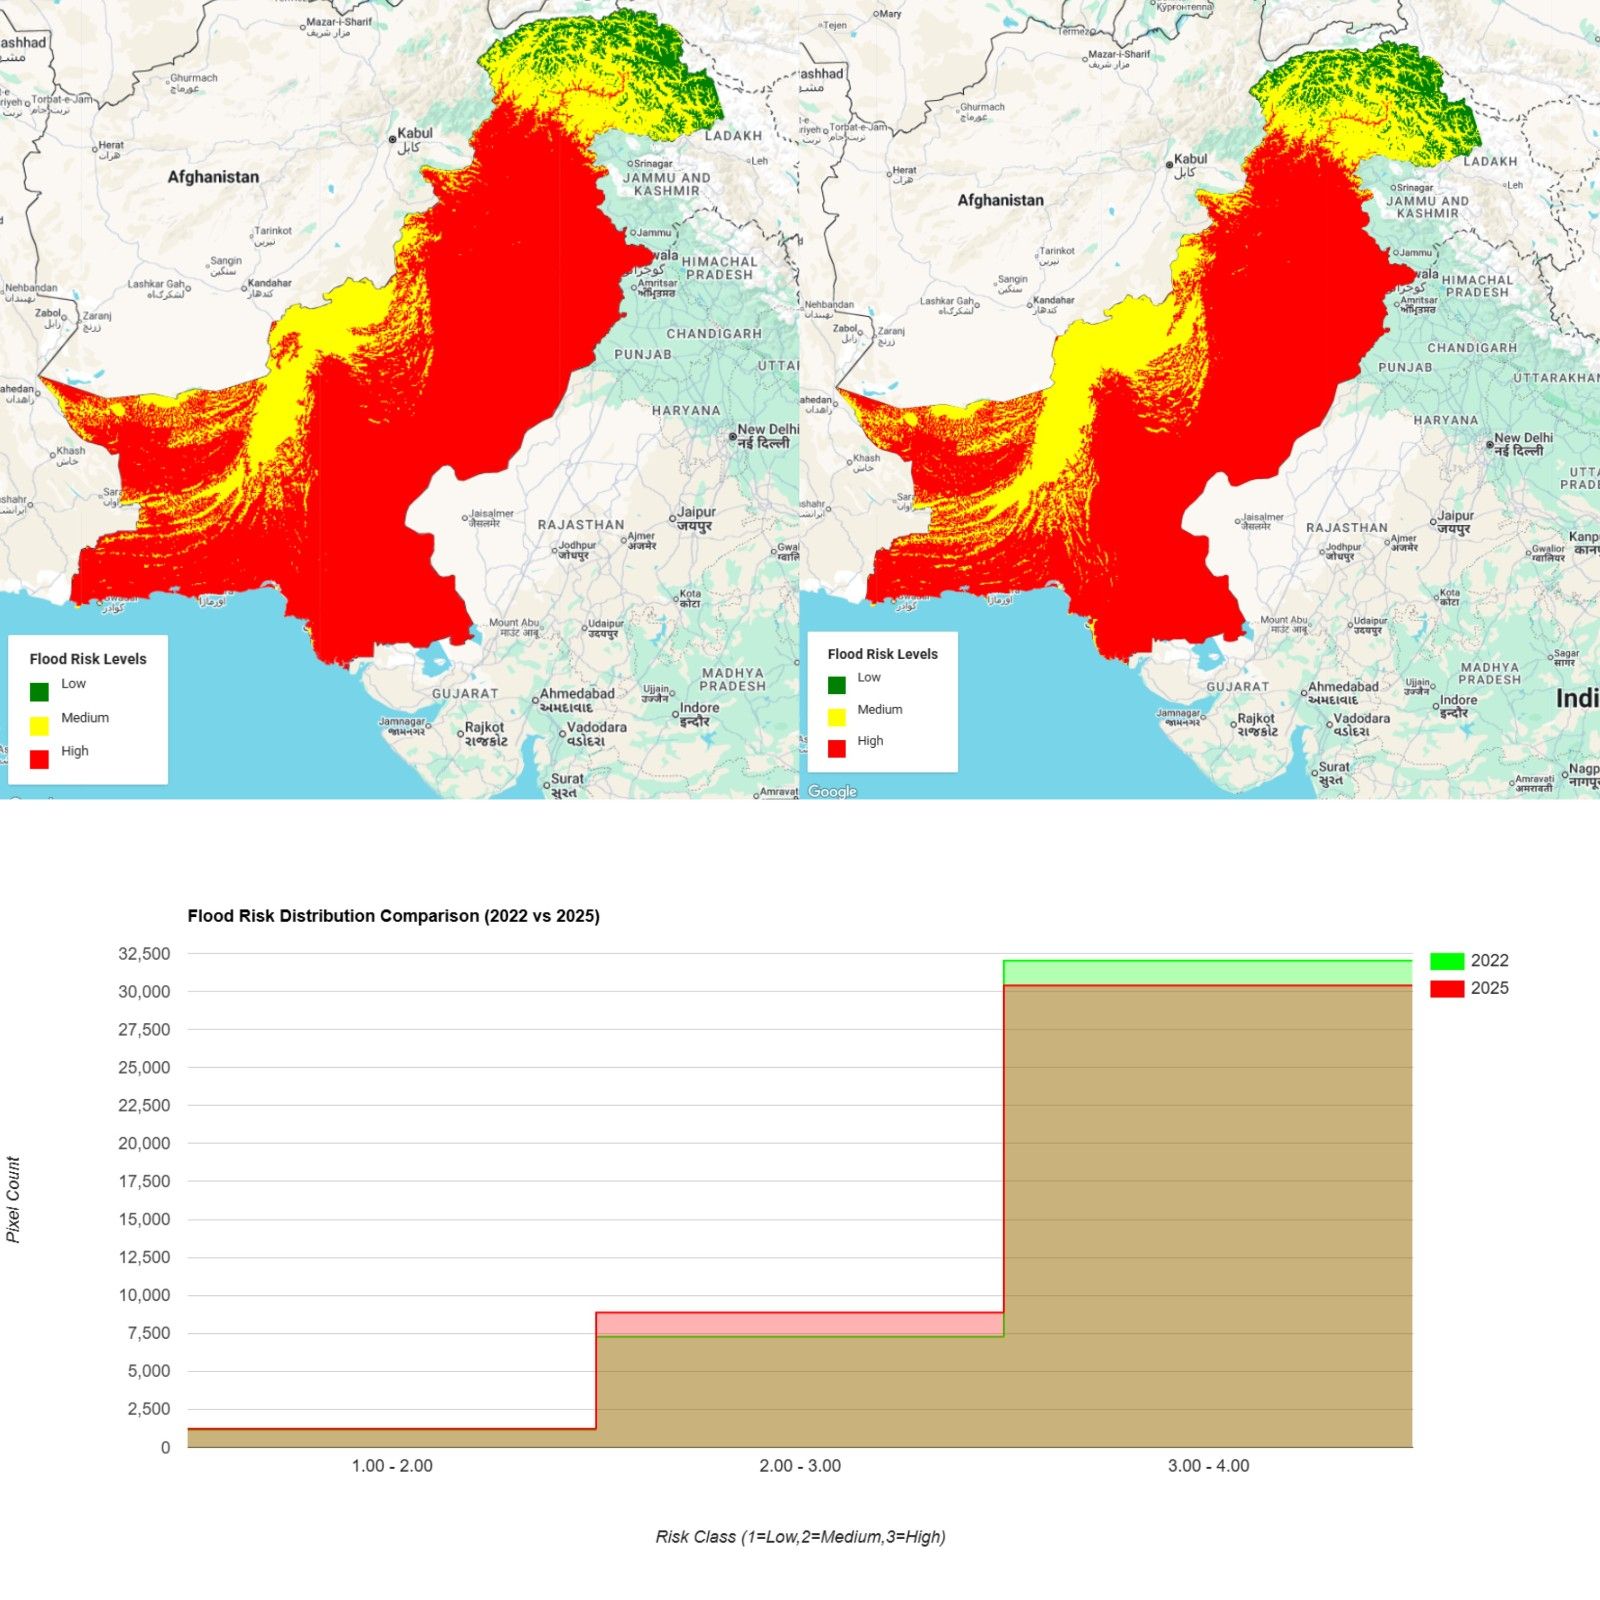
Flood Risk Analysis of Pakistan (2022–2025)
This project assesses flood risk across Pakistan for the years
2022 and 2025 using a multi-criteria geospatial modeling
approach. Annual precipitation, elevation, and distance to river
networks were integrated to generate a normalized flood risk
index and classify areas into low, medium, and high flood risk
zones. The results support flood hazard assessment, disaster
risk reduction, and climate impact studies.
Data Sources: CHIRPS, Copernicus DEM, HydroSHEDS
Tools: Google Earth Engine
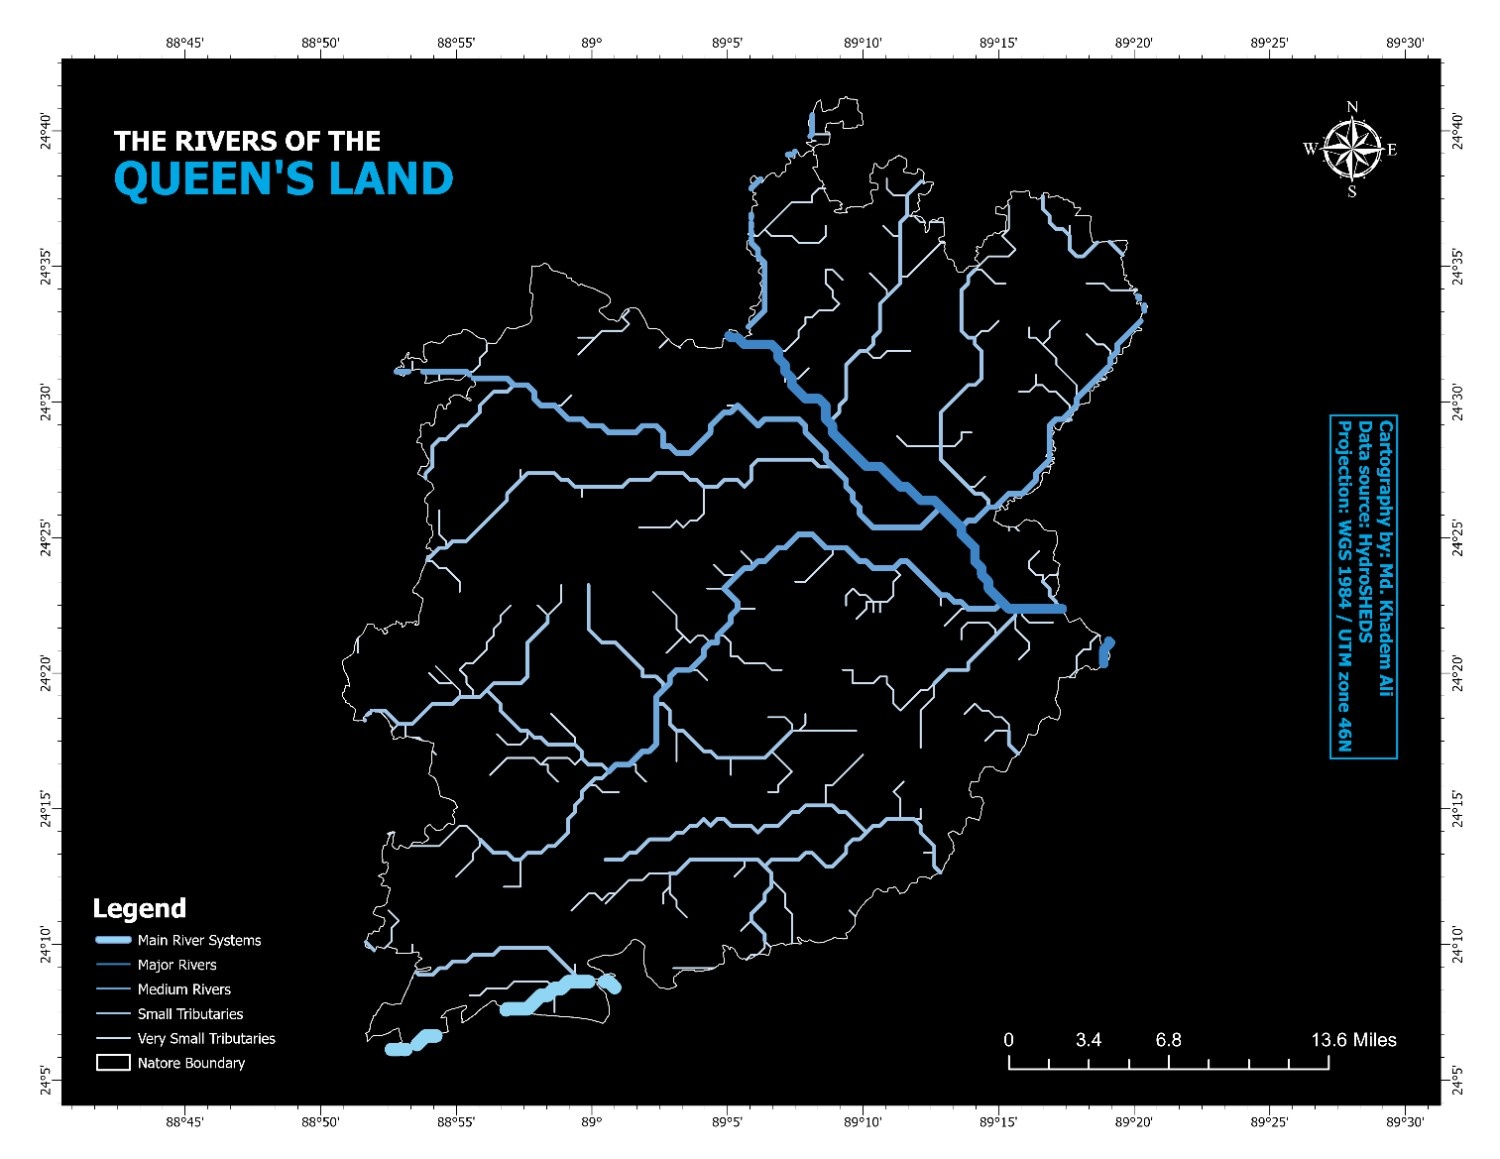
The project titled "The Rivers of the Queen's Land" was
conducted by me, Md Khadem Ali, using ArcGIS Pro. This project
maps and visualizes the river networks of Natore District,
highlighting the intricate waterways that have historically
shaped the region's landscape. By analyzing and presenting the
rivers through spatial visualization and
hydrology-focused mapping, the project provides
insights into the interaction between natural waterways and
human settlements. The visualization emphasizes Natore's unique
geography, its wetlands, and the historical significance of
rivers in connecting communities and supporting livelihoods.
Data Source: HydroSHEDS | Software: ArcGIS Pro
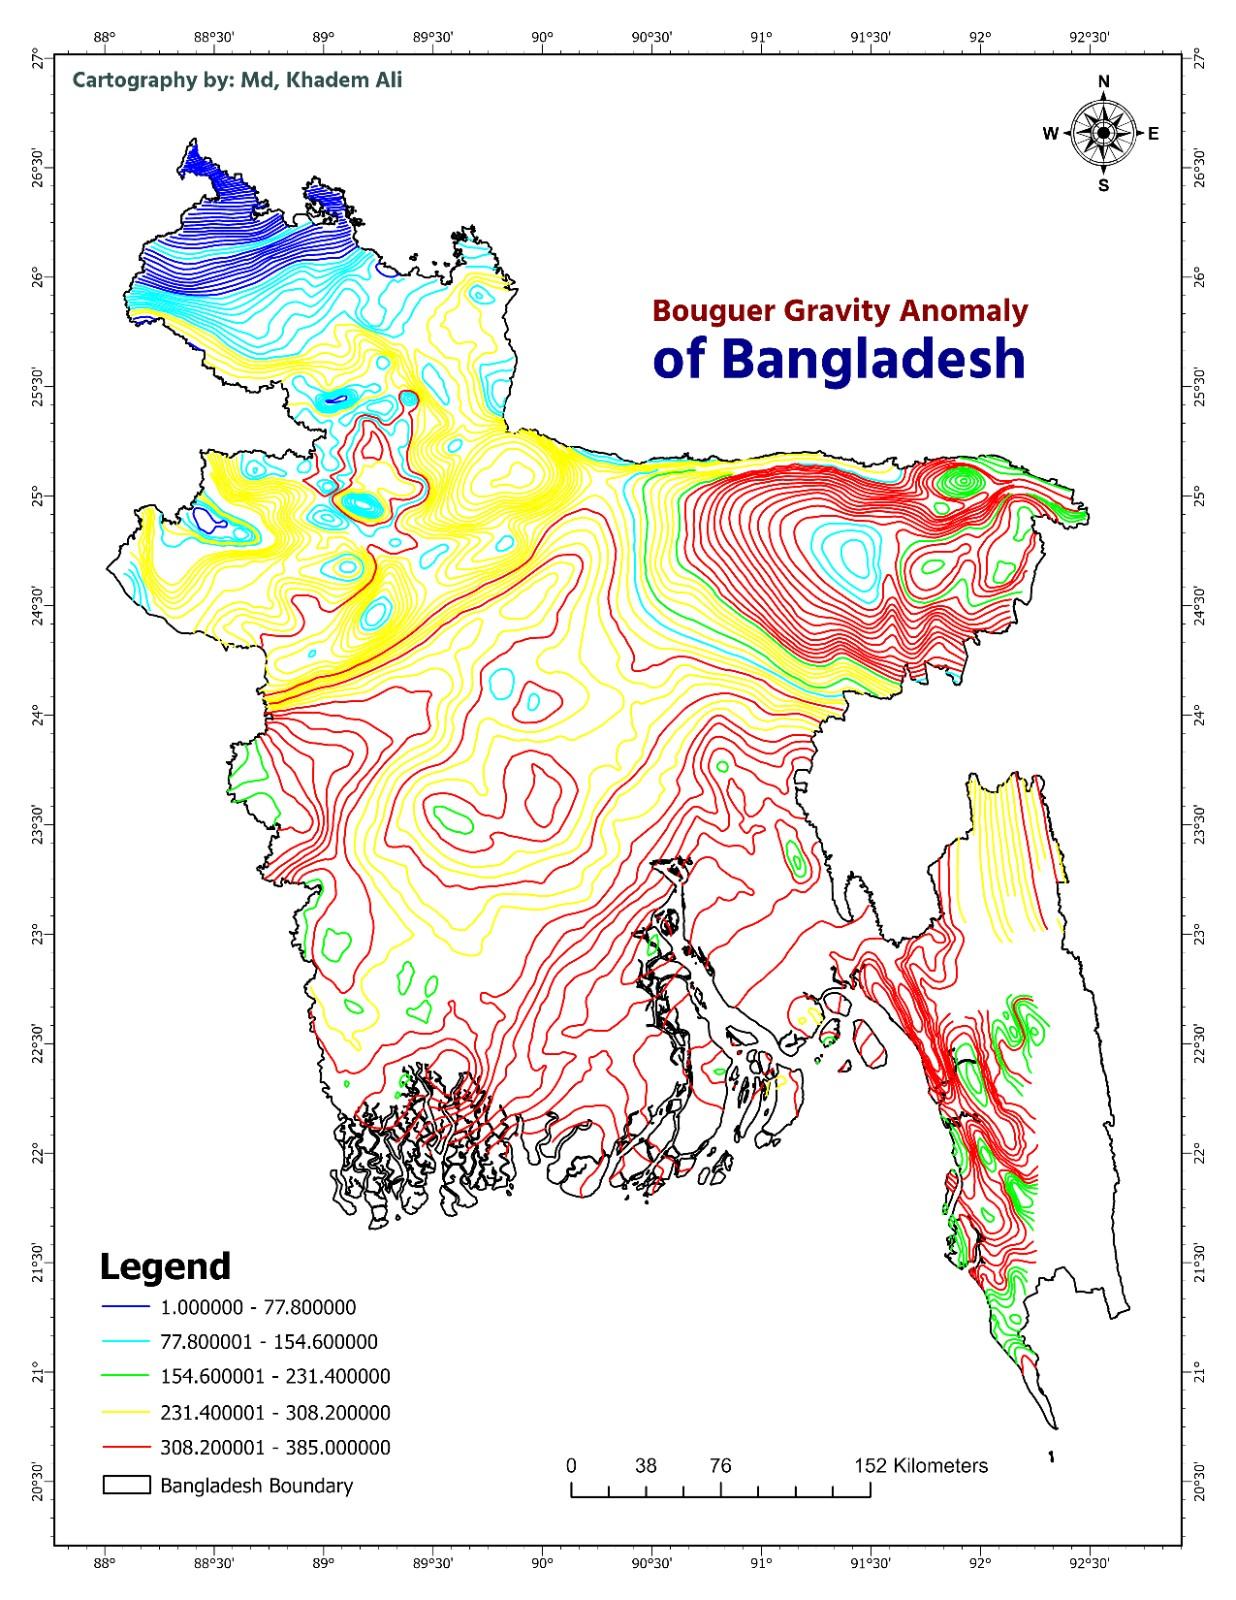
Bouguer Gravity Anomaly of Bangladesh
The project titled "Bouguer Gravity Anomaly of Bangladesh" was
conducted by me, Md Khadem Ali, using ArcGIS Pro. This project
converts point-based gravity measurements into
raster surfaces, generates contour lines, and
visualizes subsurface density variations using a
five-class color scheme. This approach provides a clear
and interpretable view of gravity anomalies across Bangladesh,
highlighting variations in subsurface structures and tectonic
features. Designed with a professional color palette and clear
legends, this visualization supports applications in geophysical
interpretation, tectonic analysis, and spatial
decision-making.
Data Source: U.S. Geological Survey (USGS) | Software: ArcGIS
Pro
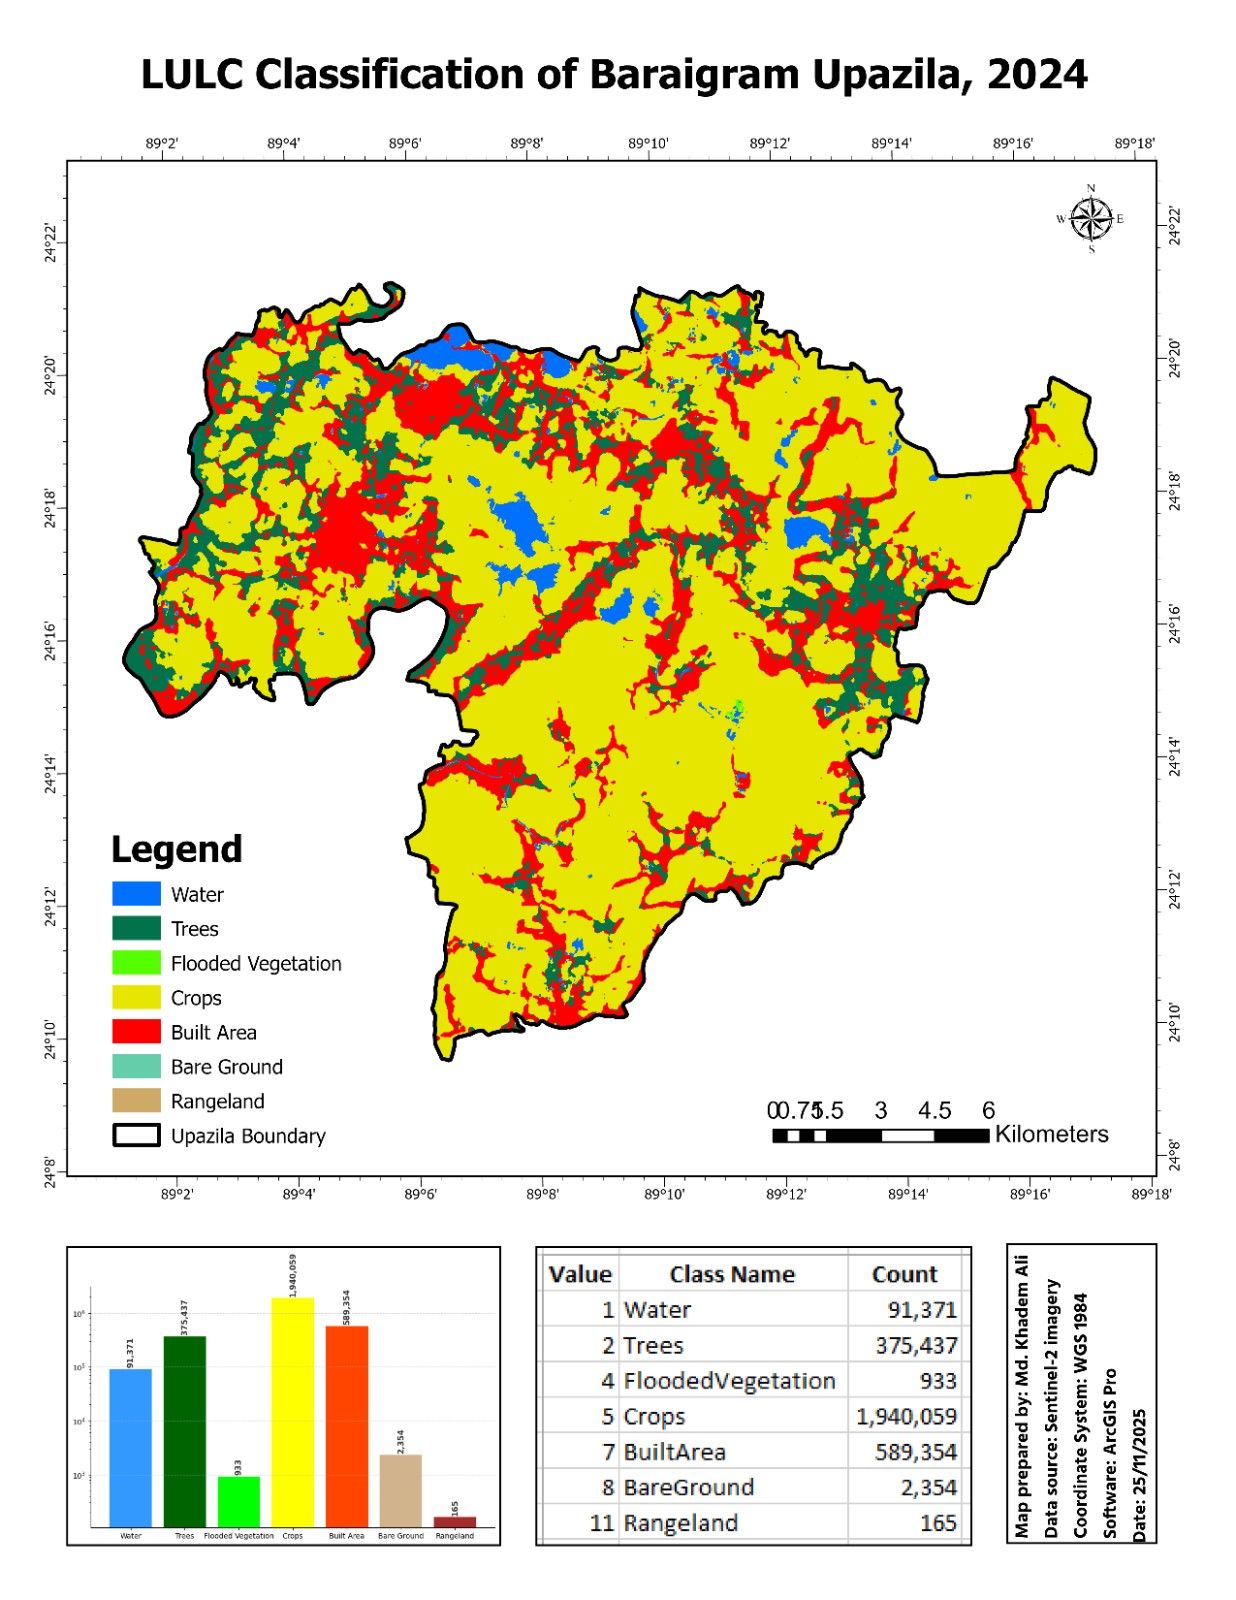
Baraigram Upazila LULC Analysis 2024
The project titled "Baraigram Upazila Land Use / Land Cover
(LULC) Analysis 2024" was conducted by me, Md Khadem Ali, using
ArcGIS Pro. This project classifies the area into seven land
cover classes:
Water, Trees, Flooded Vegetation, Crops, Built Area, Bare
Ground,
and Rangeland, based on Sentinel-2 imagery. To enhance
readability and interpretability, histogram plots were created
using Python (Matplotlib), displaying the counts for all
classes. This approach ensures even smaller classes, such as
Rangeland and Flooded Vegetation, are clearly visualized.
Designed with a professional color palette and clear legends,
this visualization provides a comprehensive overview of the land
cover distribution in Baraigram Upazila, supporting applications
in environmental planning, agricultural assessment, and
geospatial analysis.
Data Source: Sentinel-2 imagery | Software: ArcGIS Pro &
Python (Matplotlib)
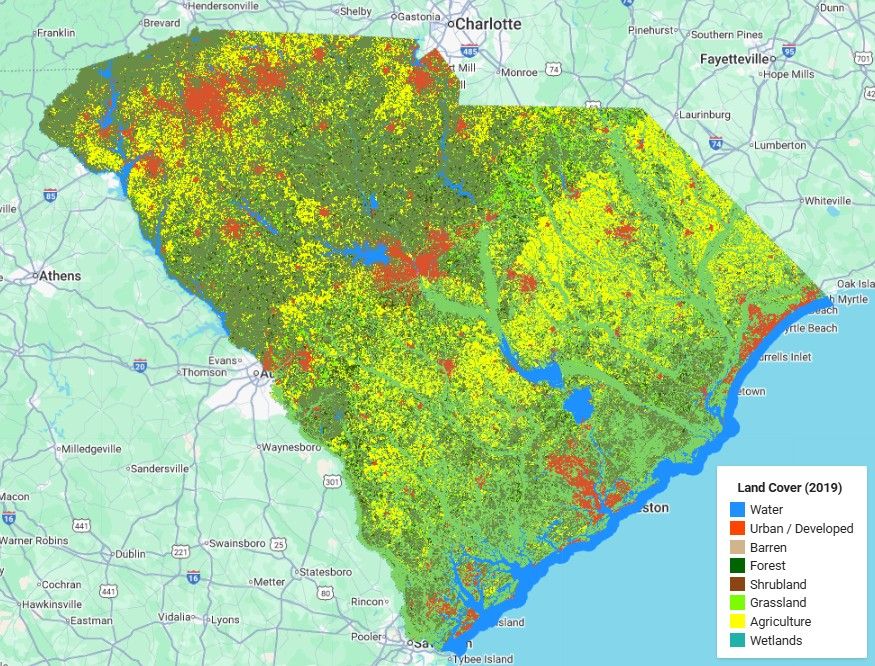
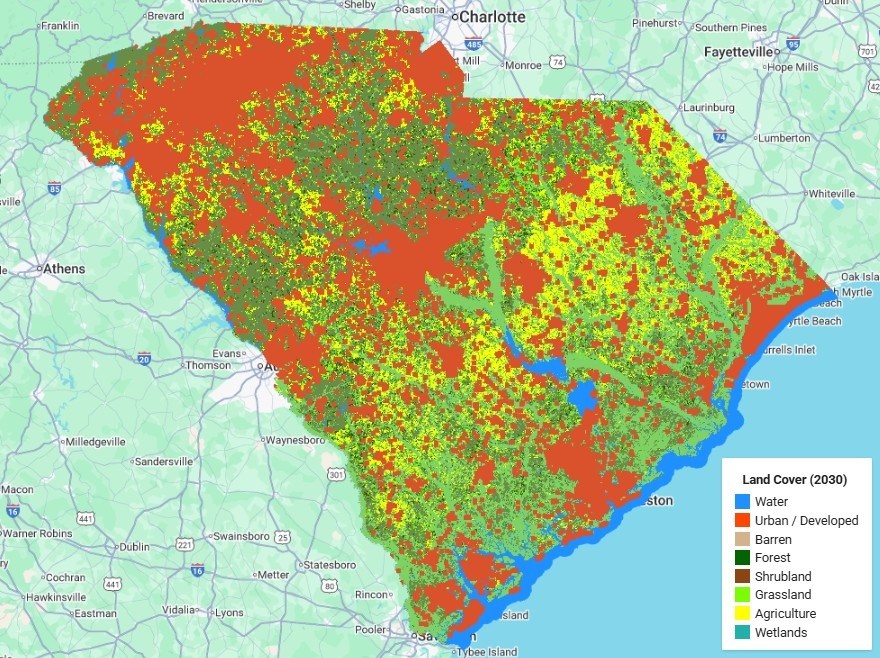
South Carolina LULC Change Prediction (2019–2030)
The project titled "South Carolina Land Use & Land Cover Change
Prediction (2019–2030)" was conducted by me, Md Khadem Ali,
using a combination of Google Earth Engine and geospatial
analysis techniques. This project visualizes the existing land
cover of South Carolina for 2019 and predicts possible changes
by 2030 through a rule-based urban growth model. The 2019 map
highlights baseline land cover categories such as Water, Urban,
Forest, Agriculture, Grassland, Shrubland, Barren land, and
Wetlands, while the 2030 predicted map shows potential urban
expansion and landscape changes over the next decade.
Integrating spatial maps with predictive modeling provides an
intuitive understanding of land cover dynamics, making it
suitable for research, planning, and decision-making purposes.
The visualizations are designed with clear legends, distinctive
color coding, and a professional layout to enhance readability
and interpretation.
Data Source: USGS NLCD 2019, TIGER/US Census Boundaries,
Google Earth Engine
The project titled "Bangladesh Topography & Water Map" was
conducted by me, Md Khadem Ali, using Google Earth Engine (GEE).
This project visualizes the elevation patterns and hydrological
landscape of Bangladesh through high-resolution digital
elevation data and river network overlays. It integrates
COPERNICUS DEM (GLO-30)/ for topographic elevation, WWF
HydroSHEDS for rivers and drainage systems, and USDOS LSIB
(2017) for national boundaries. The map classifies the country
into six elevation-based zones,
Floodplain / Lowland (<5 m), Agricultural Plains (5–10 m),
Upland / Medium (10–30 m), Hills (30–60 m), Hilltops (>60
m),
and Rivers & Water Bodies, offering a comprehensive
view of Bangladesh's physiographic diversity from the coastal
deltaic plains to the eastern hills. Designed with a
professional color palette and clear legends, this visualization
supports applications in environmental planning, agricultural
assessment, and climate resilience research.
Data Source: COPERNICUS DEM (ESA), WWF HydroSHEDS, USDOS LSIB
(2017)
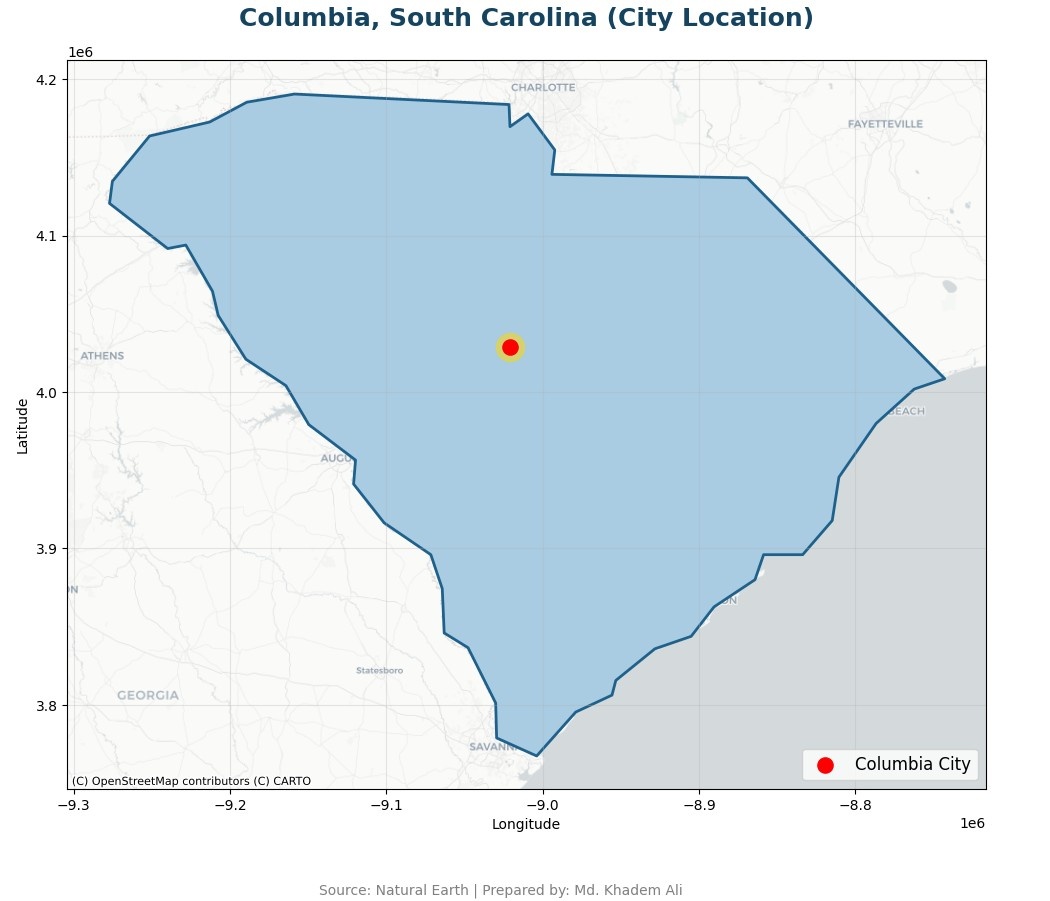
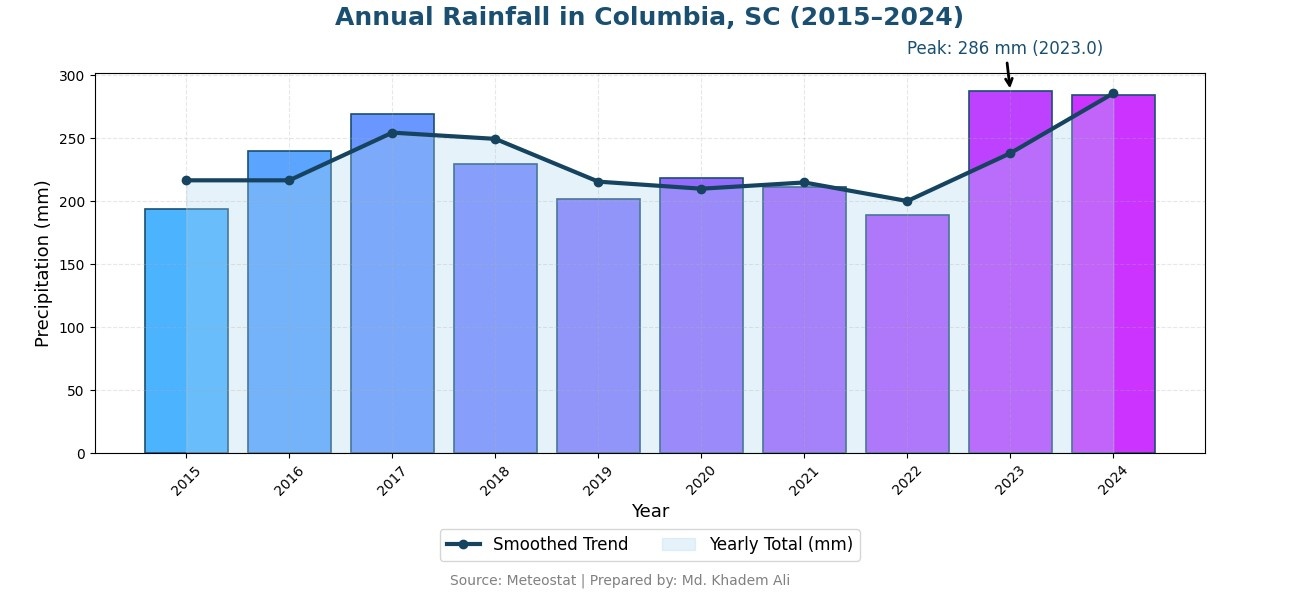
The project titled "Columbia, SC Precipitation Analysis
(2015–2024)" was conducted by me, Md Khadem Ali, using a
combination of Python (GeoPandas, Pandas, Matplotlib,
Contextily, Meteostat) and Google Colab. This project visualizes
the annual precipitation trends of Columbia, South Carolina over
the past decade through a detailed city map and a complementary
bar chart for year-wise rainfall comparison. The map highlights
the location of Columbia within South Carolina, while the bar
chart provides a clear quantitative summary of total
precipitation in millimeters and inches for each year.
Integrating spatial maps with analytical charts allows for an
intuitive understanding of rainfall patterns, making it suitable
for educational purposes, presentations, and analytical
insights. The visualizations are designed with clean legends,
gradient color coding, and footers to maintain a professional
and readable layout.
Data Source: Meteostat (2015–2024) & PublicaMundi / Natural
Earth GeoJSON
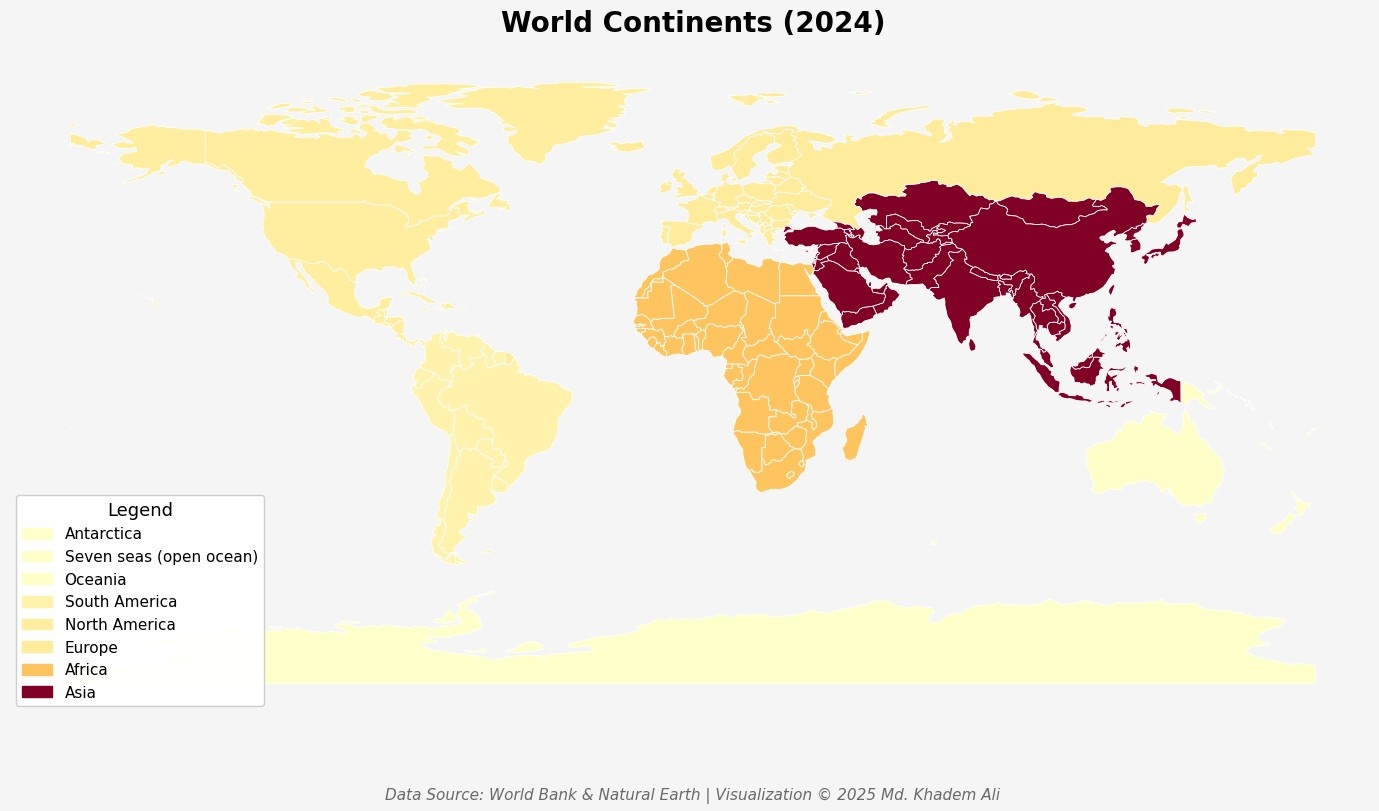
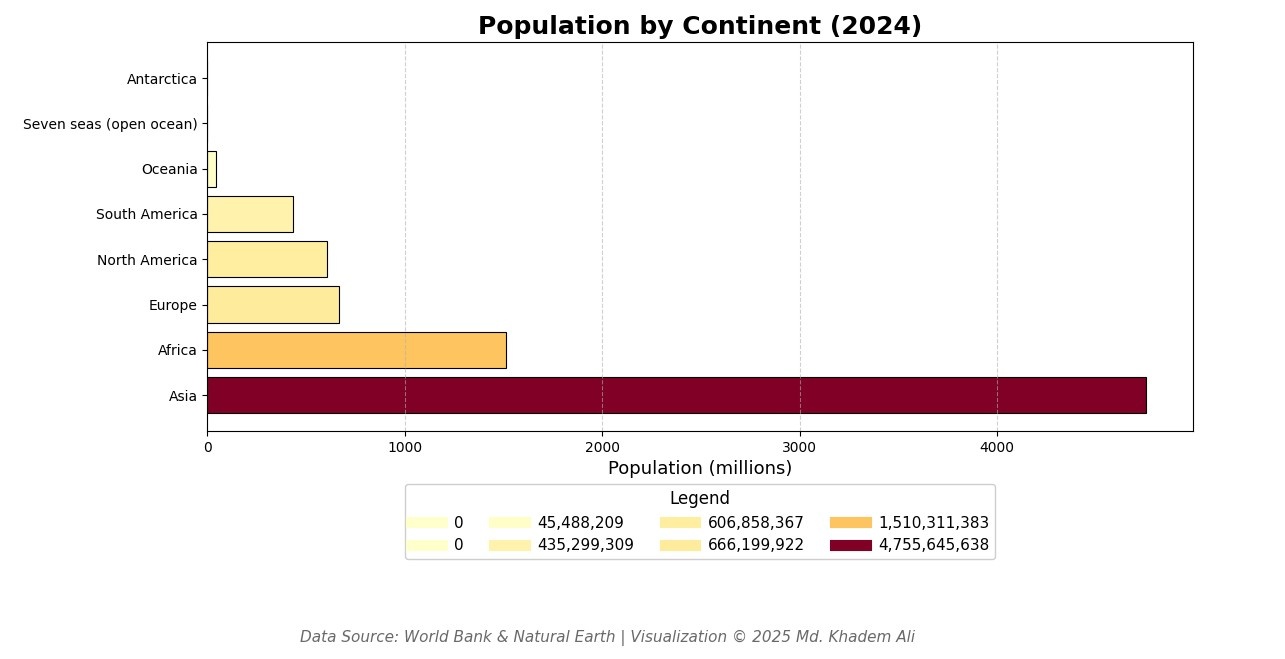
The project titled "World Continent Population Visualization
(2024)" was conducted by me, Md Khadem Ali, using a combination
of Python (GeoPandas, Pandas, Matplotlib) and Google Colab. This
project visualizes the population distribution of continents
globally through a world map and complements it with a
horizontal bar chart for a continent-wise comparison. The world
map highlights population differences across continents, while
the bar chart provides a clear quantitative summary of total
population in millions for each continent. Integrating spatial
maps with analytical charts allows for an intuitive
understanding of global population patterns, making it suitable
for educational purposes, presentations, and analytical
insights. The visualizations are designed with clean legends,
gradient color coding, and footers to maintain a professional
and readable layout.
Data Source: World Bank (2024) & Natural Earth (1:110m
Cultural Vectors, 2024)
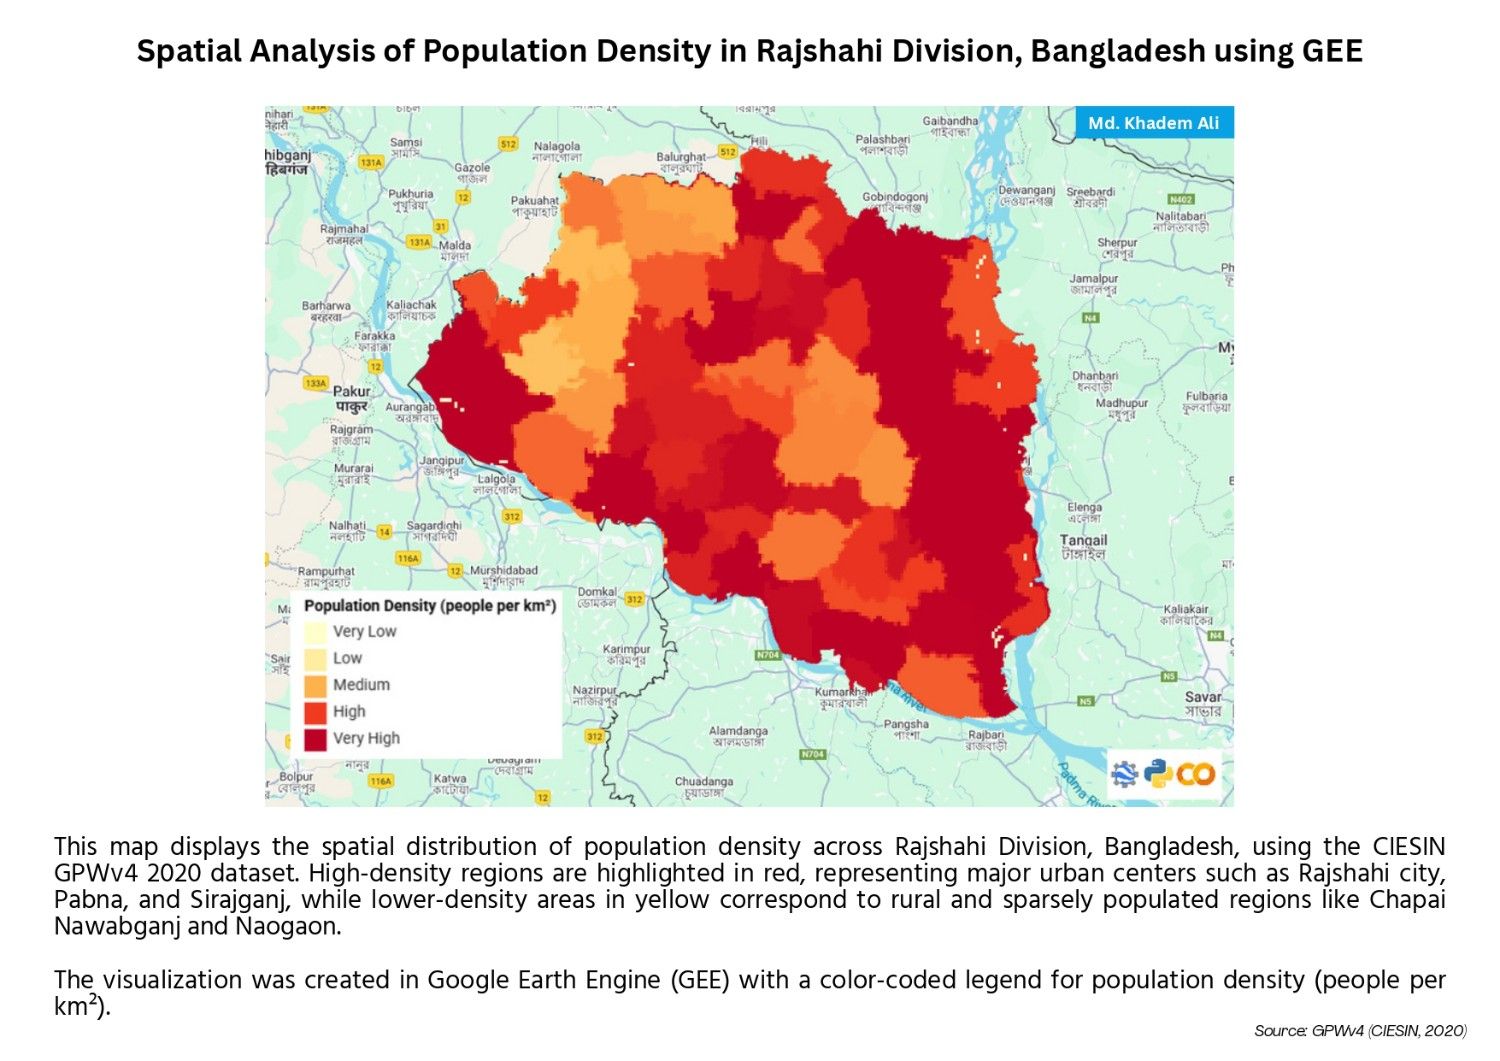
Population Density Analysis of Rajshahi Division (2020)
The project titled "Population Density Analysis of Rajshahi
Division" was conducted by me, Md Khadem Ali, using a
combination of Google Earth Engine (GEE) and Python (matplotlib
/ Google Colab). This project visualizes both the spatial
distribution of population across the division and a
district-wise comparison through analytical bar charts. The GEE
map highlights high-density urban areas such as Sirajganj,
Pabna, and Rajshahi City, while rural districts like Chapai
Nawabganj and Naogaon exhibit relatively lower population
densities. Complementing this, the Python-based bar chart
provides a clear quantitative comparison, enabling quick
identification of population patterns. This visualization
demonstrates how integrating spatial maps with statistical
charts can yield actionable insights for urban planning,
resource allocation, and policy-making.
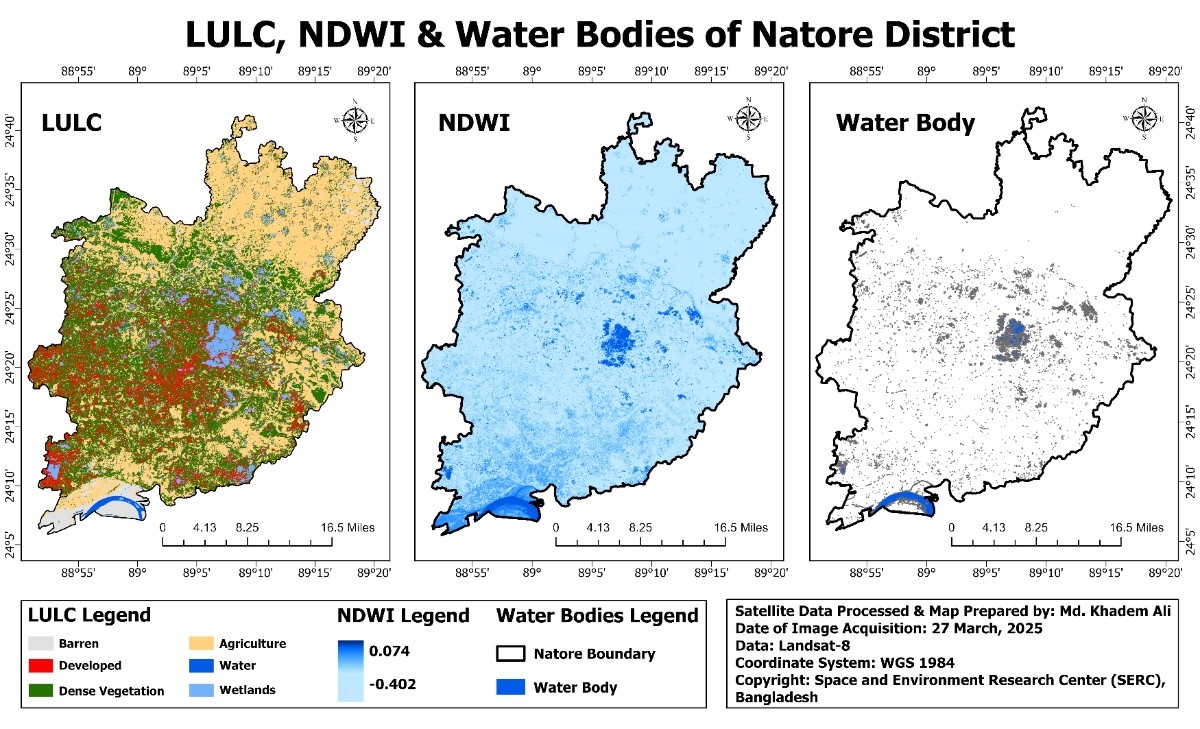
The map titled "LULC, NDWI & Water Bodies of Natore District"
was prepared by me, Md Khadem Ali, as part of the project "Space
Based Observation of Wetlands of Bangladesh: Wetland Inventory,
Assessment and Monitoring", implemented under the SERC (Space
and Environment Research Center) Wetland Conservation Program.
This map presents spatial analysis of Land Use Land Cover
(LULC), Normalized Difference Water Index (NDWI), and extracted
water bodies of Natore District, based on satellite imagery
acquired on 27 March 2025. The analysis was performed using
Landsat-8 data and spatial processing was conducted using the
WGS 1984 coordinate system. All data processing, analysis, and
map preparation were done using ArcGIS Pro. This project was
supervised by Mithun Kumar, Scientific Officer & Head,
Aeronautics & Space Applications Division, Space and Environment
Research Center (SERC), Bangladesh.
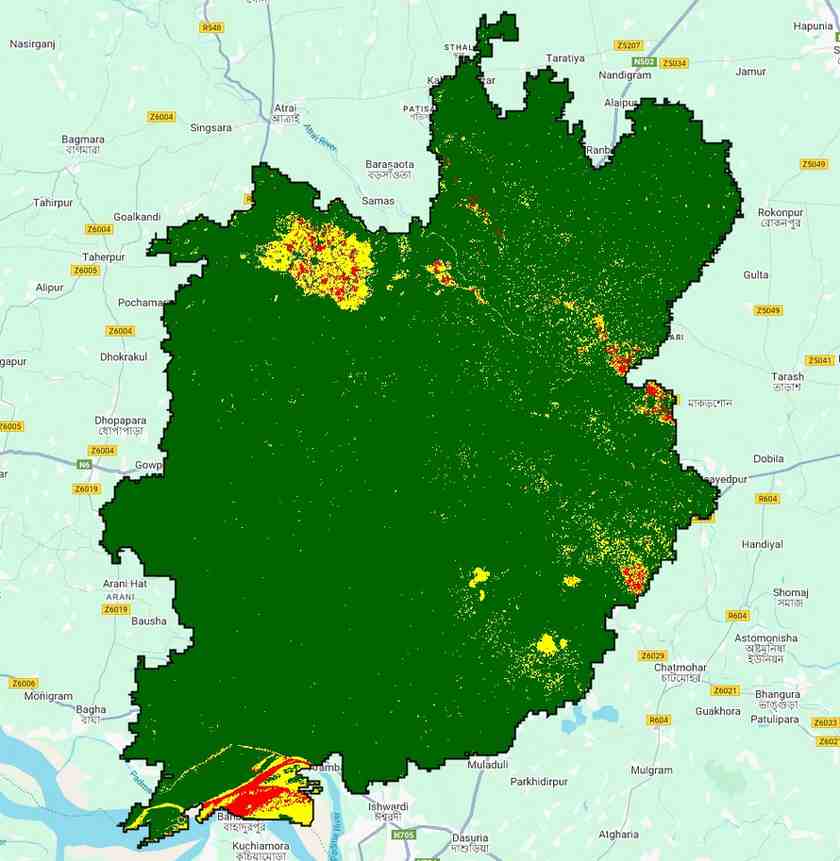
This project generates a Flood Risk Map for Natore District,
Bangladesh using Google Earth Engine (GEE). It integrates
Sentinel-1 SAR data, SRTM elevation, and Sentinel-2 NDVI to
assess flood vulnerability. Risk zones are calculated by
combining water presence, low elevation, and vegetation cover
into a weighted index. The final map displays flood risk levels
with green (low), yellow (medium), and red (high) zones for easy
interpretation. This tool supports disaster preparedness and
localized flood risk assessment.
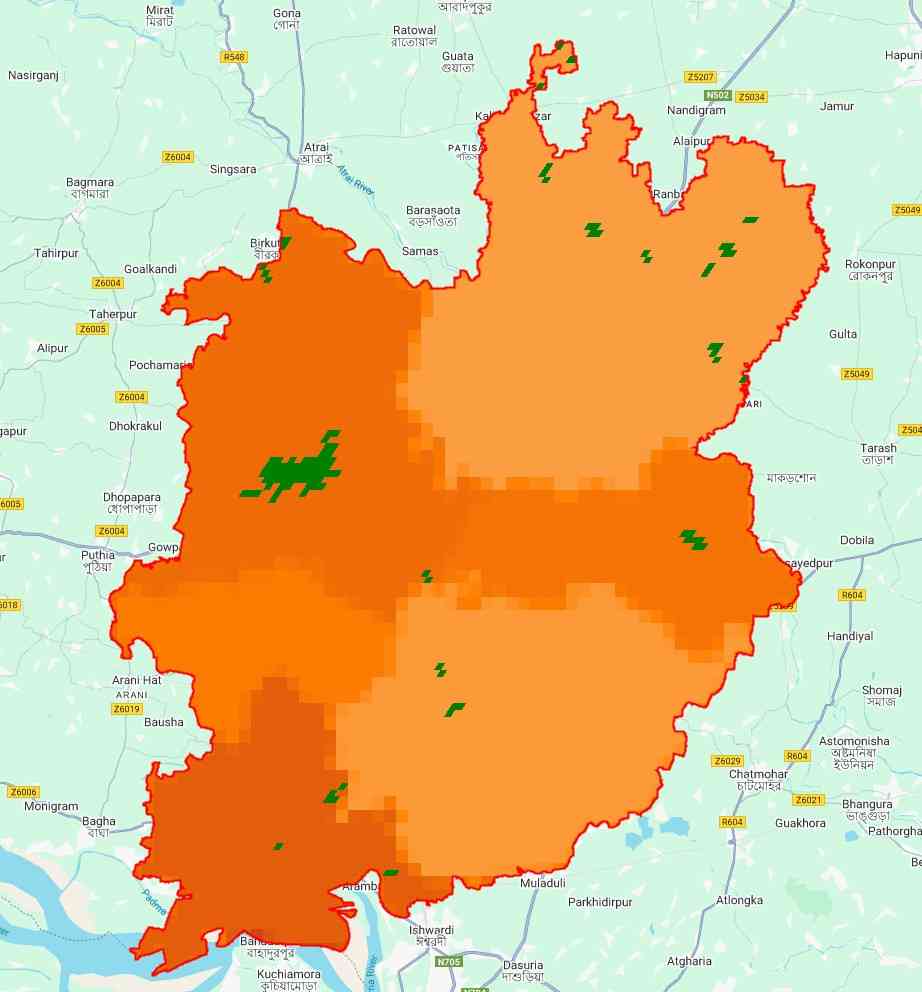
This project analyzes urbanization trends and infrastructure
patterns in Natore District, Bangladesh, using satellite-based
geospatial data. By integrating population density (CIESIN),
land cover (MODIS), and administrative boundaries (FAO GAUL), it
highlights urban growth and densely populated areas. The study
supports urban planning by identifying zones requiring
infrastructure development. Visual outputs include color-coded
maps for population and urban areas, aiding in clear,
data-driven decision-making.
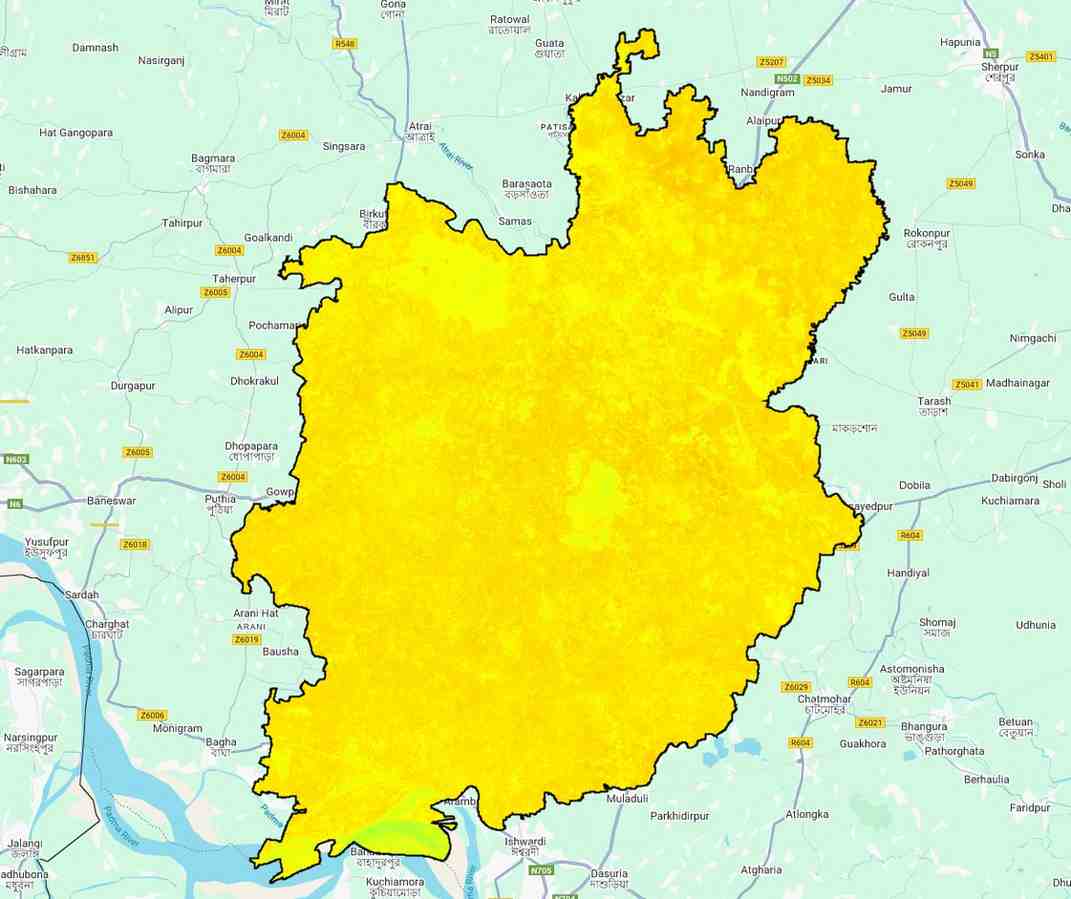
This project analyzes vegetation health in Natore Zilla,
Bangladesh using NDVI derived from Sentinel-2 imagery via Google
Earth Engine. It provides full regional coverage with a custom
color-coded NDVI map, highlighting variations in plant density
and health. The workflow is scalable and offers exportable
statistical outputs for further research. This analysis supports
informed decision-making in agriculture and environmental
sustainability.
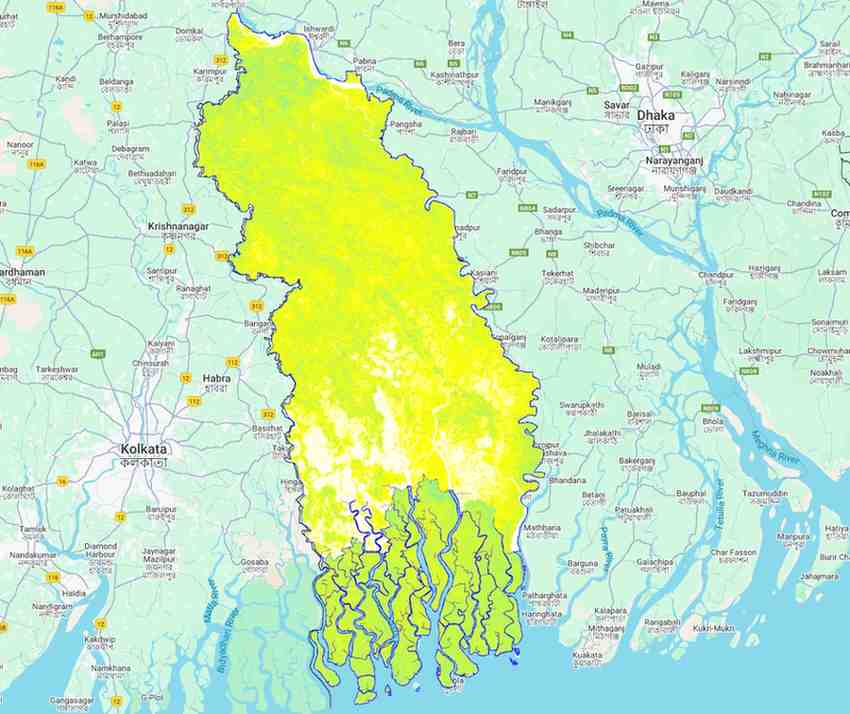
This project analyzes the vegetation health of the
Khulna-Sundarbans region using NDVI derived from Landsat 8
satellite imagery via Google Earth Engine. Focusing on the year
2022, it highlights vegetation density, forest coverage, and
areas under environmental stress. The NDVI values are visualized
with a custom color palette to distinguish healthy forests from
degraded or barren areas. This analysis supports ecological
monitoring and conservation planning in the Sundarbans.
GeoKhadem: A Lightweight Python Library for GIS & Remote Sensing
This is a private project. Code not publicly available.
GeoKhadem is a Python library developed by me
to support basic GIS and Remote Sensing tasks such as NDVI/NDWI
computation, raster analysis, and spatial data handling. It was
designed as a personal challenge to build a reusable, modular
geospatial toolkit for educational and research purposes. The
project enhanced my understanding of package structure,
documentation writing, and Python-based geospatial processing.
I have developed a Chrome Extension that detects geographic
location data such as place names and coordinates from any
webpage, allowing users to instantly visualize them on an
interactive map. The extension features right-click context menu
integration, regex-based coordinate detection, and map
visualization using Leaflet.js. This tool helps researchers,
journalists, and GIS professionals quickly extract and analyze
spatial data directly from web content.
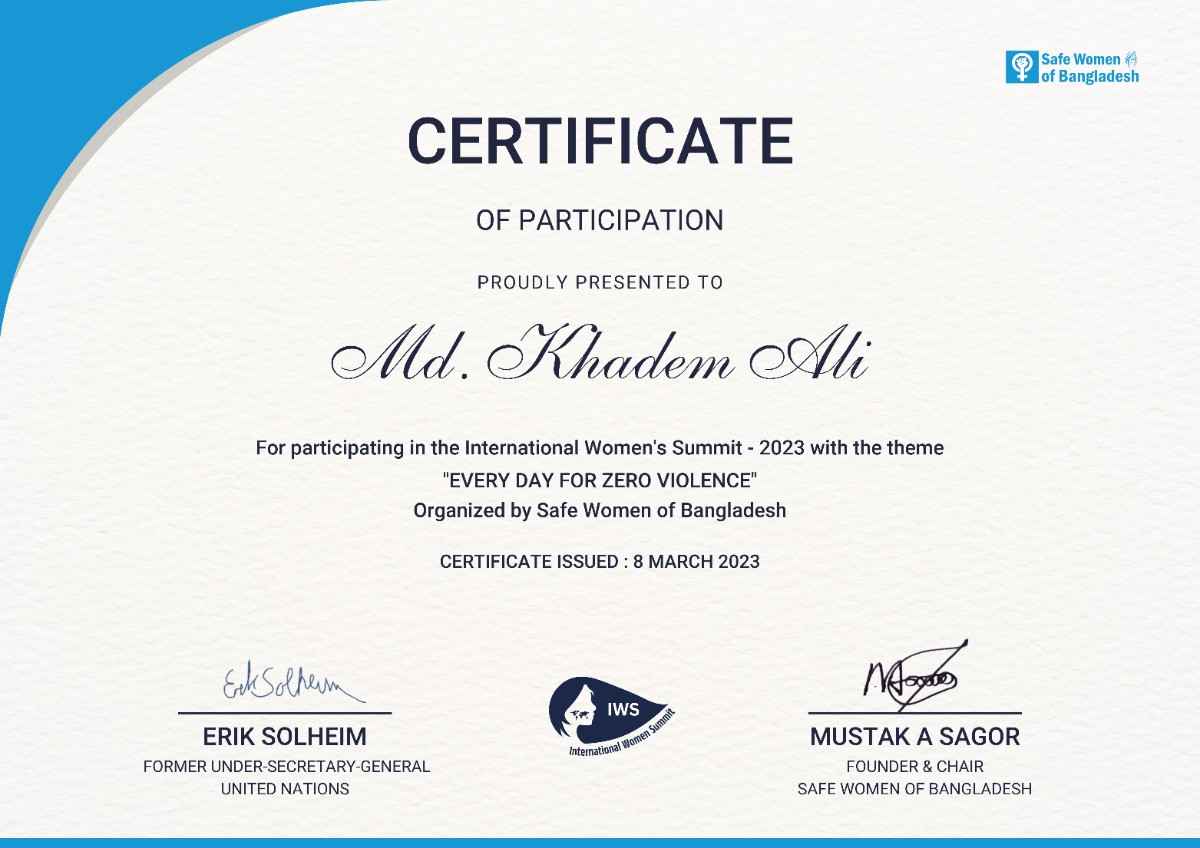
I have successfully completed
90+
verified and authentic certifications from recognized institutions
across diverse fields, including GIS & Remote Sensing, Machine
Learning, Data Science, Social Impact, and Volunteering. Each
certification is globally recognized and credible, reflecting my
continuous learning journey and skill development.
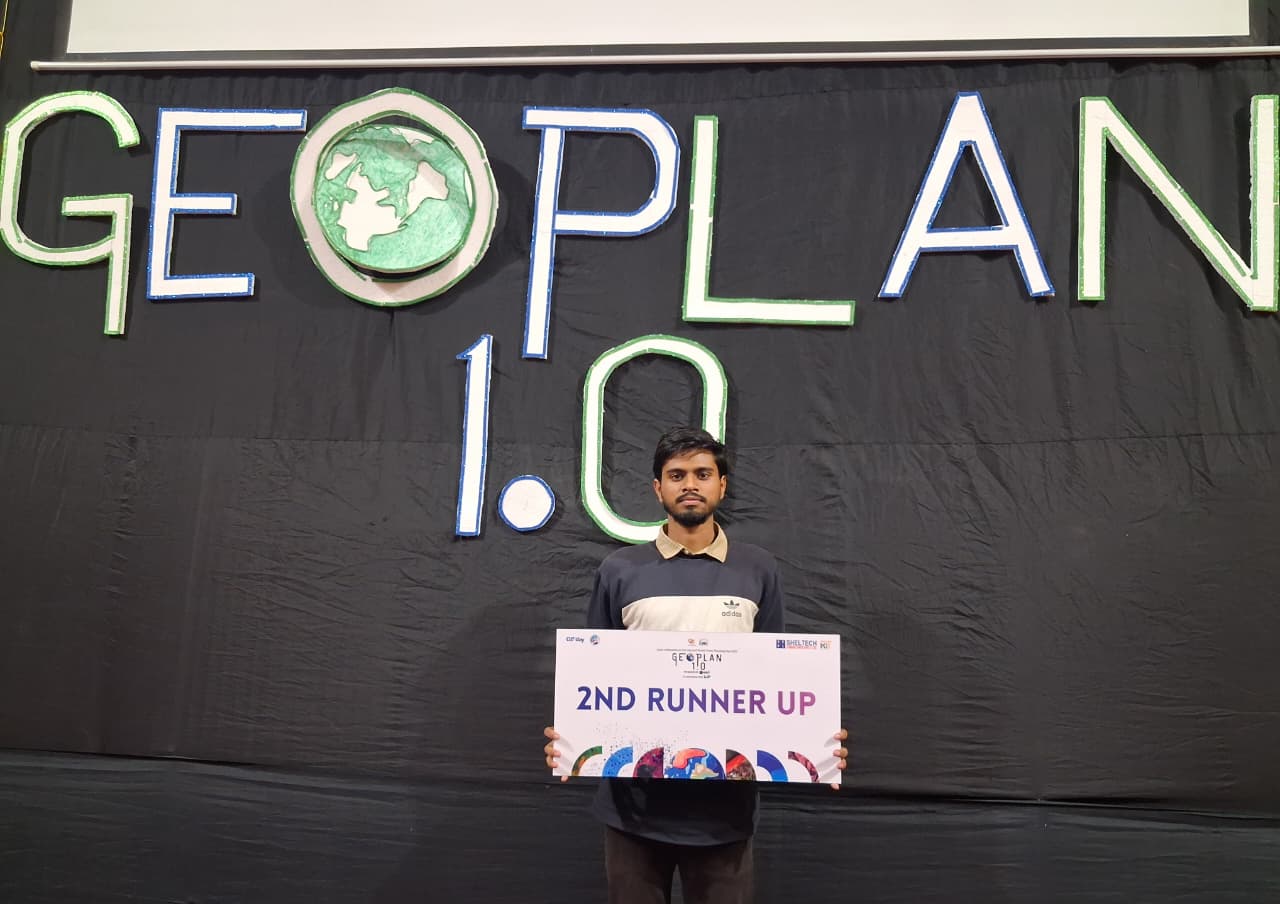
Organized by RUET GIS Club (GeoPlan 1.0) & Esri Recognized
Awarded: December 06, 2025
Achieved 2nd Runner-Up in the Cartography category for the
project titled "Vegetation Dynamics in Natore Zila
(2015–2025) Using Landsat 8 NDVI on Google Earth Engine" at
GeoPlan 1.0, one of the most competitive GIS events with
participation from major universities across Bangladesh.
GeoPlan 1.0 was proudly organized by RUET GIS & the Esri
Recognized Chapter at RUET.
Beyond academics and technical research, I occasionally engage in
writing, reflective thinking, and interdisciplinary exploration
out of personal interest and curiosity during my leisure time. I
regularly publish articles, essays, and analytical writings on
science, history, philosophy, geopolitics, society, human
evolution, civilization, literature, and the future technology
through blogs, digital magazines, and independent platforms.
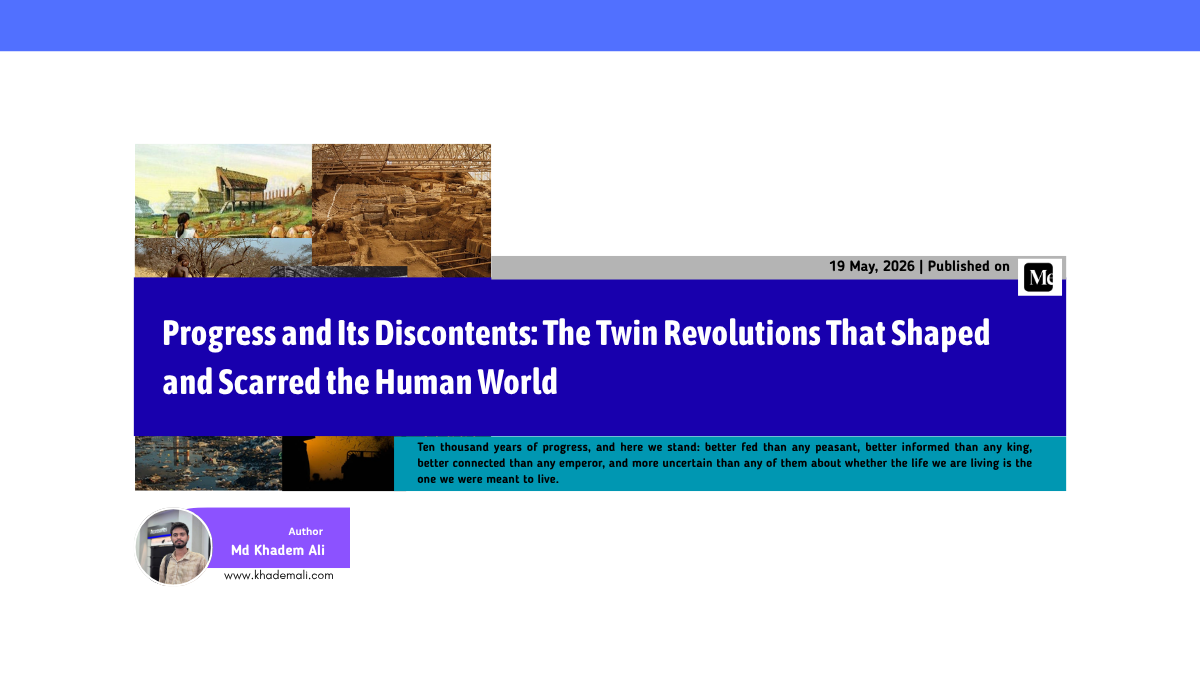
Ten thousand years. Two revolutions. One question that neither
historians nor philosophers have managed to settle: did any of
it make us better off, and if so, better off than whom?
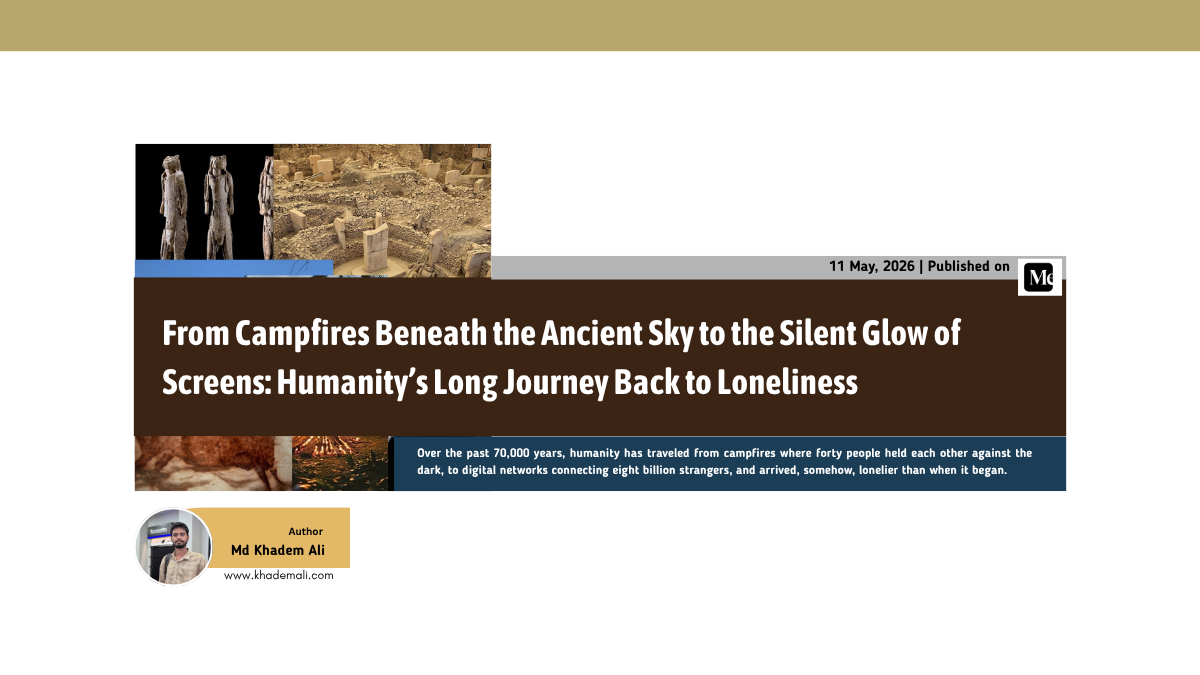
Over the past 70,000 years, humanity has traveled from
campfires where forty people held each other against the dark,
to digital networks connecting eight billion strangers and
arrived, somehow, lonelier than when it began.
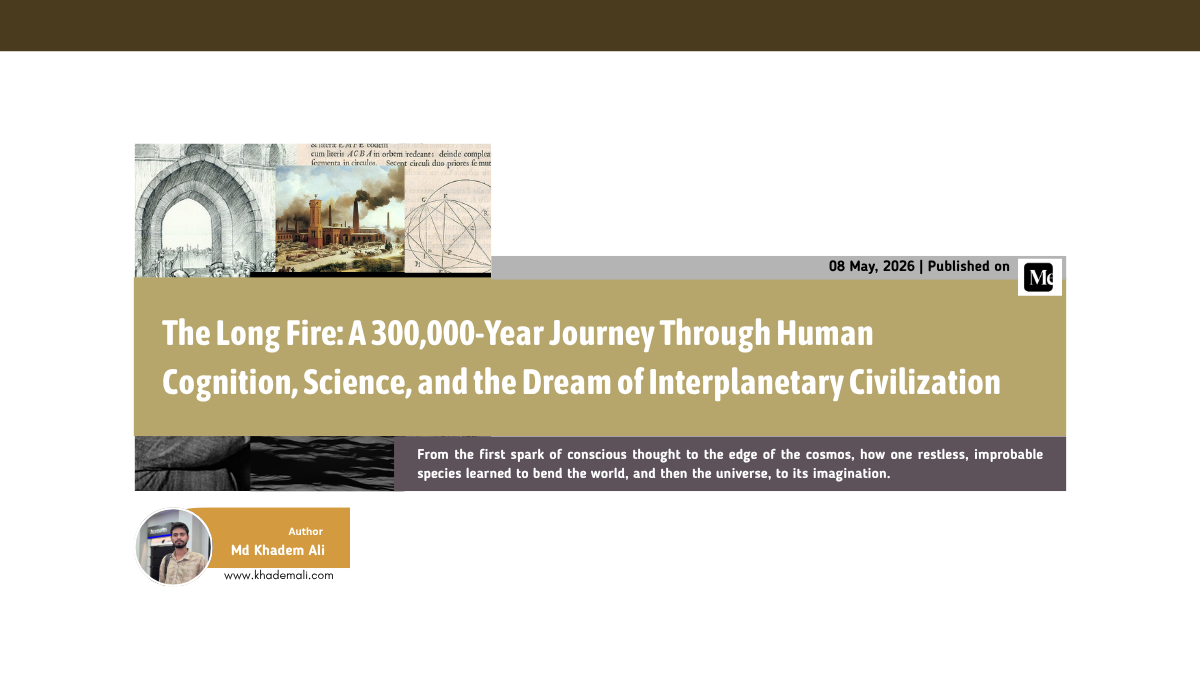
From the first spark of conscious thought to the edge of the
cosmos, how one restless, improbable species learned to bend
the world, and then the universe, to its imagination.
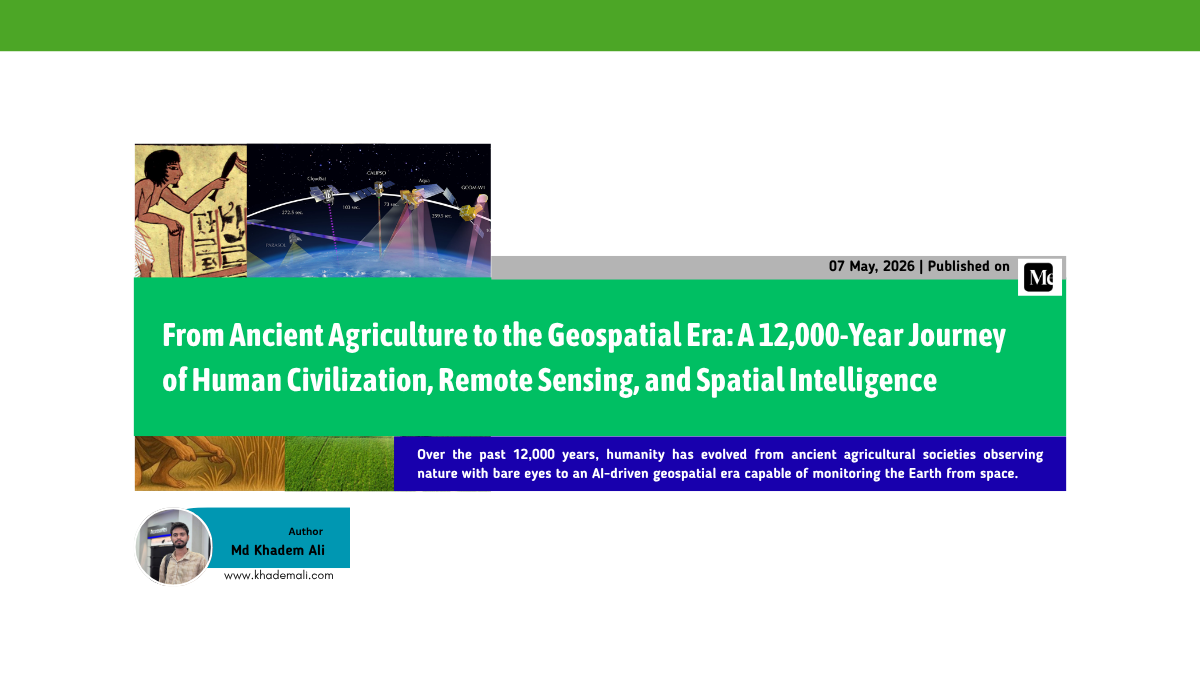
Over the past 12,000 years, humanity has evolved from ancient
agricultural societies observing nature with bare eyes to an
AI-driven geospatial era capable of monitoring the Earth from
space.
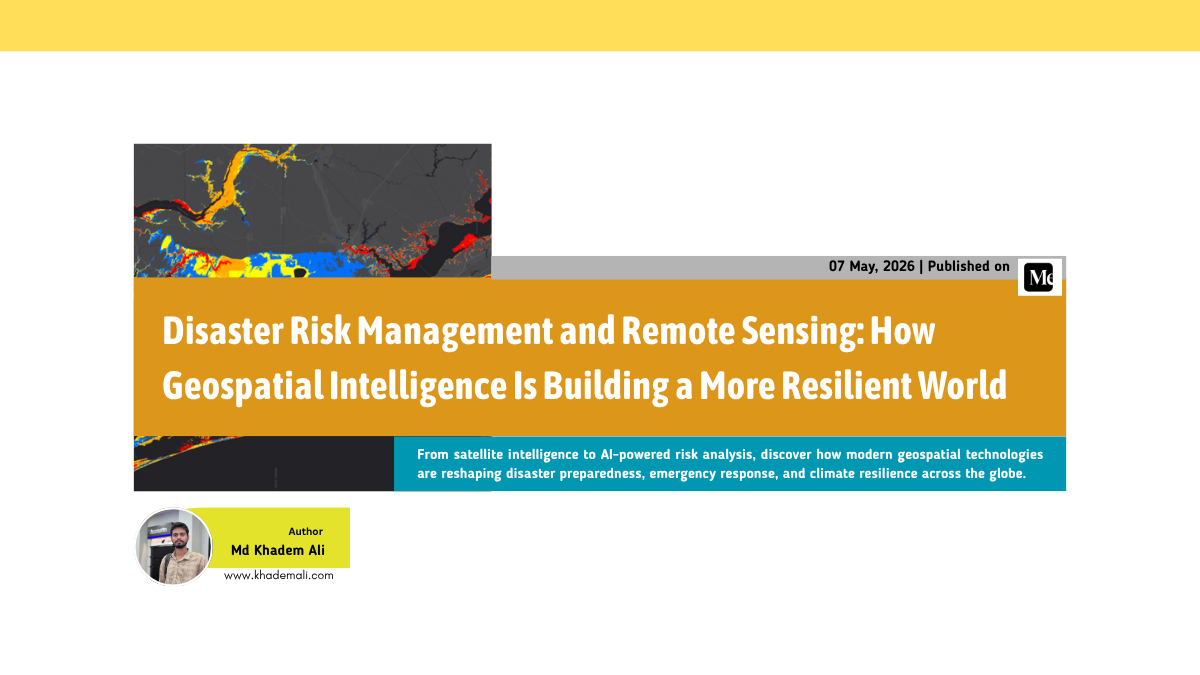
From satellite intelligence to AI-powered risk analysis,
discover how modern geospatial technologies are reshaping
disaster preparedness, emergency response, and climate
resilience across the globe.
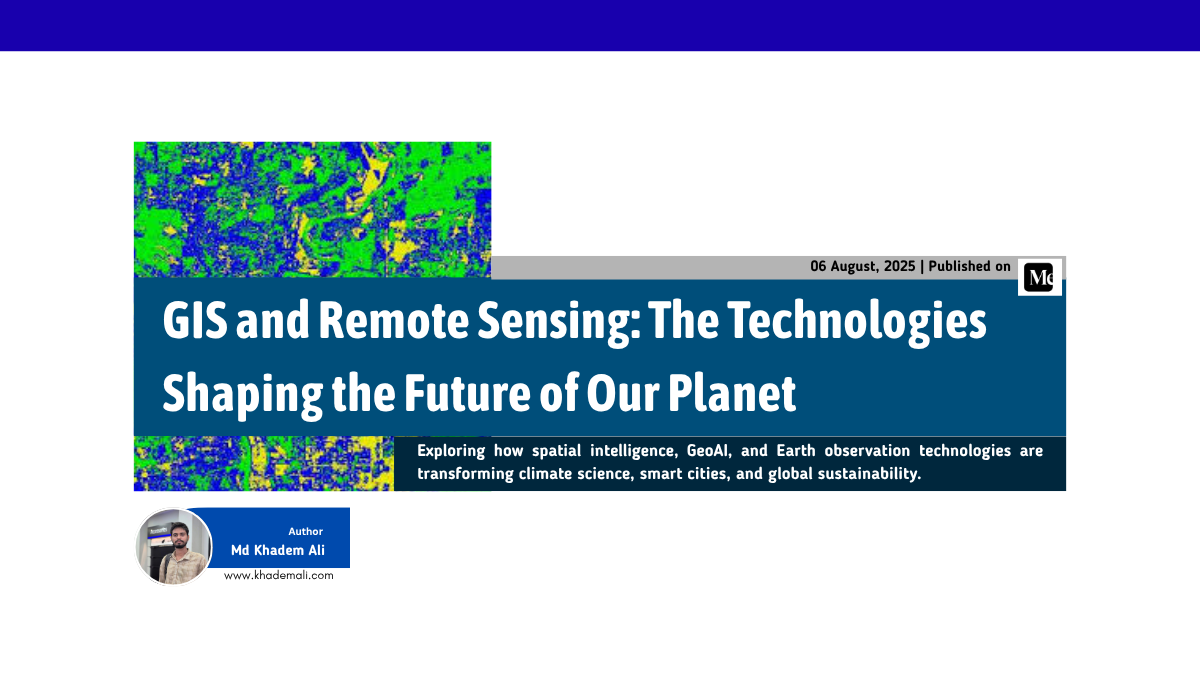
Exploring how spatial intelligence, GeoAI, and Earth
observation technologies are transforming climate science,
smart cities, and global sustainability.
Assistant Professor & Head, Department of Geography and
Environment, Shahid M. Mansur Ali College
"Md Khadem Ali is an academically gifted and intellectually
curious student with a strong passion for Geographic Information
Systems (GIS) and geospatial research. Throughout his academic
journey, he has undertaken several innovative and well-executed
projects that clearly demonstrate his technical proficiency and
analytical capabilities. He consistently shows strong motivation
to learn, explore new methodologies, and rigorously prepare
himself for research endeavors. His discipline, commitment, and
eagerness for continuous growth are truly commendable. As his
teacher, I hold him in the highest regard. His integrity,
enthusiasm, and academic potential have left a lasting
impression on me. I firmly believe that Khadem possesses the
qualities necessary to achieve remarkable success in research
and academia."
Md Rokibul Islam
PhD Student, Department of Mechanical Engineering, University
of South Carolina, USA
"I have known Md Khadem Ali for more than a decade. Due to close
proximity for a very long time, years of experience of working
together on social activities related to popular science and
long sessions of discussions on philosophical, literary and
technical topics, I can testify about his indomitable desire to
learn technical and non-technical things. Perhaps he is the best
self-driven learner I have ever met. I have some intersection
with his technical expertise too in the area of programming, AI,
and Machine Learning. He crossed many walls on his path to this
position, being the first graduate (would be) in his paternal
line of ancestry, and he proved great resilience in overcoming
those. I strongly believe that he is a person with a researcher
mindset with outstanding ability to focus, high readiness to
learn anything needed and determination to produce intended
results. I recommend him highly for any research position he
desires to achieve."
Md Haider Ali
Assistant Teacher, Diargarfa Khairash (D.K) High School
"I have known Md Khadem Ali since 2014, when he was a student in
Class Six at our school. I had the opportunity to teach him from
Class Six through Class Ten, during which I developed a strong
appreciation for his character and dedication. Khadem has always
been humble, responsible, and attentive. His keen interest in
reading, particularly in philosophy and critical thinking, has
continually impressed me. He actively participated in student
organizations and demonstrated excellent skills in science
fairs, quizzes, and Olympiads. Although he is now a former
student, I continue to maintain a good relationship with him and
take pride in having taught such a promising individual. I
firmly believe that Khadem will achieve great success in the
future."
Nahid Amin
Software Engineer, ICEL Technology and Entertainment
"I highly recommend Md Khadem Ali for his work in Geographic
Information Systems (GIS) and remote sensing. He investigates
how the Earth and climate are changing using satellite data and
modern analytical tools. His research contributes significantly
to understanding environmental changes and supporting informed
planning for a sustainable future."
Md Torikul Islam
Undergraduate Student, Department of CSE, Northern University,
Bangladesh and Freelance Web Developer (Fiverr)
"Khadem demonstrates an exceptional combination of reliability,
intellectual capability, and creativity, qualities that
consistently distinguish him in collaborative and project-based
settings."
Shakib Prodhan
Undergraduate Student, Department of Mechanical Engineering,
Khulna University of Engineering & Technology
"Khadem has consistently demonstrated reliability and
professionalism in every responsibility entrusted to him."
Md Alhaz Mia
Former Assistant Teacher, Polash Cadet School
"I have had the opportunity to work with Md Khadem Ali, and it
has been a highly rewarding learning experience. Beyond his
academic excellence, he is skilled in multiple fields and
demonstrates a creative and original mindset. I firmly believe
that he has the potential to make significant contributions in
any institution or organization he joins."
Contact
Get in Touch
I’m based in
Natore, a district in northern Bangladesh known for its rich
heritage, vibrant culture, and scenic landscapes. From expansive
wetlands to dynamic agricultural terrains, the region provides a
fertile ground for
geospatial research,
remote sensing, and
environmental analysis. Whether
it’s spatial storytelling or satellite data interpretation, I’m
always excited to collaborate on impactful GIS-driven projects.
Feel free to reach out, let’s turn ideas into insight.